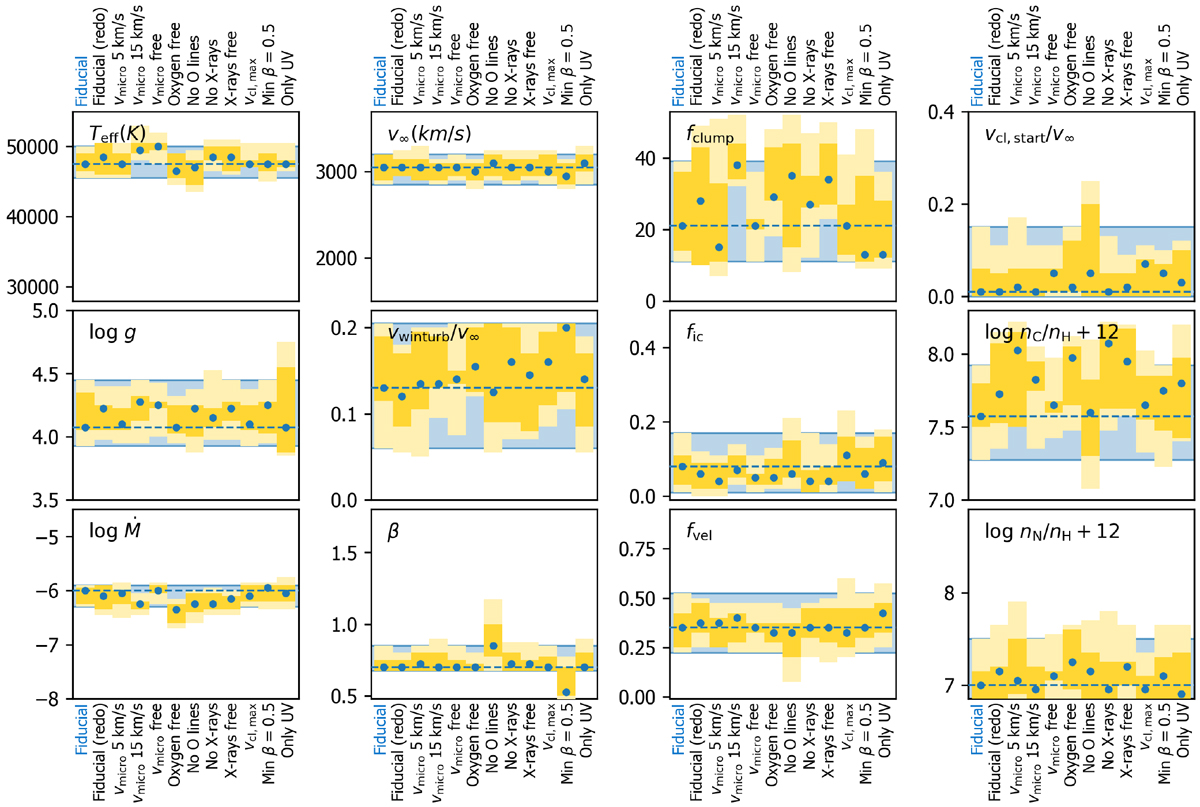
Fig. 11
Download original image
Comparison of parameters from the different test runs, fitting in each instance the spectrum of H35. For each run and each parameter we indicate the best fit value (blue dots) and 1 and 2σ error bars (dark and light yellow). In the first column we show the parameters of our ‘fiducial run’: this is the setup as used throughout the paper. The other columns show parameters of runs were we changed the setup, one aspect at the time: ‘Fiducial (redo)’ – different initial random population of models, ‘vmicro5 km s−1’ and ‘vmicro15 km s−1’ – assumed value for vmicro to 5 and 15 km s−1, respectively, instead of 10 km s−1, ‘vmicro free’ – vmicro a free parameter, ‘Oxygen free’ – oxygen abundance a free parameter, ‘No O lines’ – exclude both O iv λ1340 and O v λ1371 from the fitting, ‘No X-rays ‘ – do not include any X-rays, ‘X-rays free’ – fX a free parameter, ‘vcl,max’ – assume vcl,max = 2vcl,start instead of vcl,max/v∞ = max(0.3, vcl,start/v∞), ‘Minβ = 0.5’ – set lower limit of β to 0.5 instead of 0.7 and ‘Only UV’ – only fit the UV spectra. For reference, the best fit value and 2σ error region of the fiducial run are shown in blue throughout all columns.
Current usage metrics show cumulative count of Article Views (full-text article views including HTML views, PDF and ePub downloads, according to the available data) and Abstracts Views on Vision4Press platform.
Data correspond to usage on the plateform after 2015. The current usage metrics is available 48-96 hours after online publication and is updated daily on week days.
Initial download of the metrics may take a while.