Fig. 10
Download original image
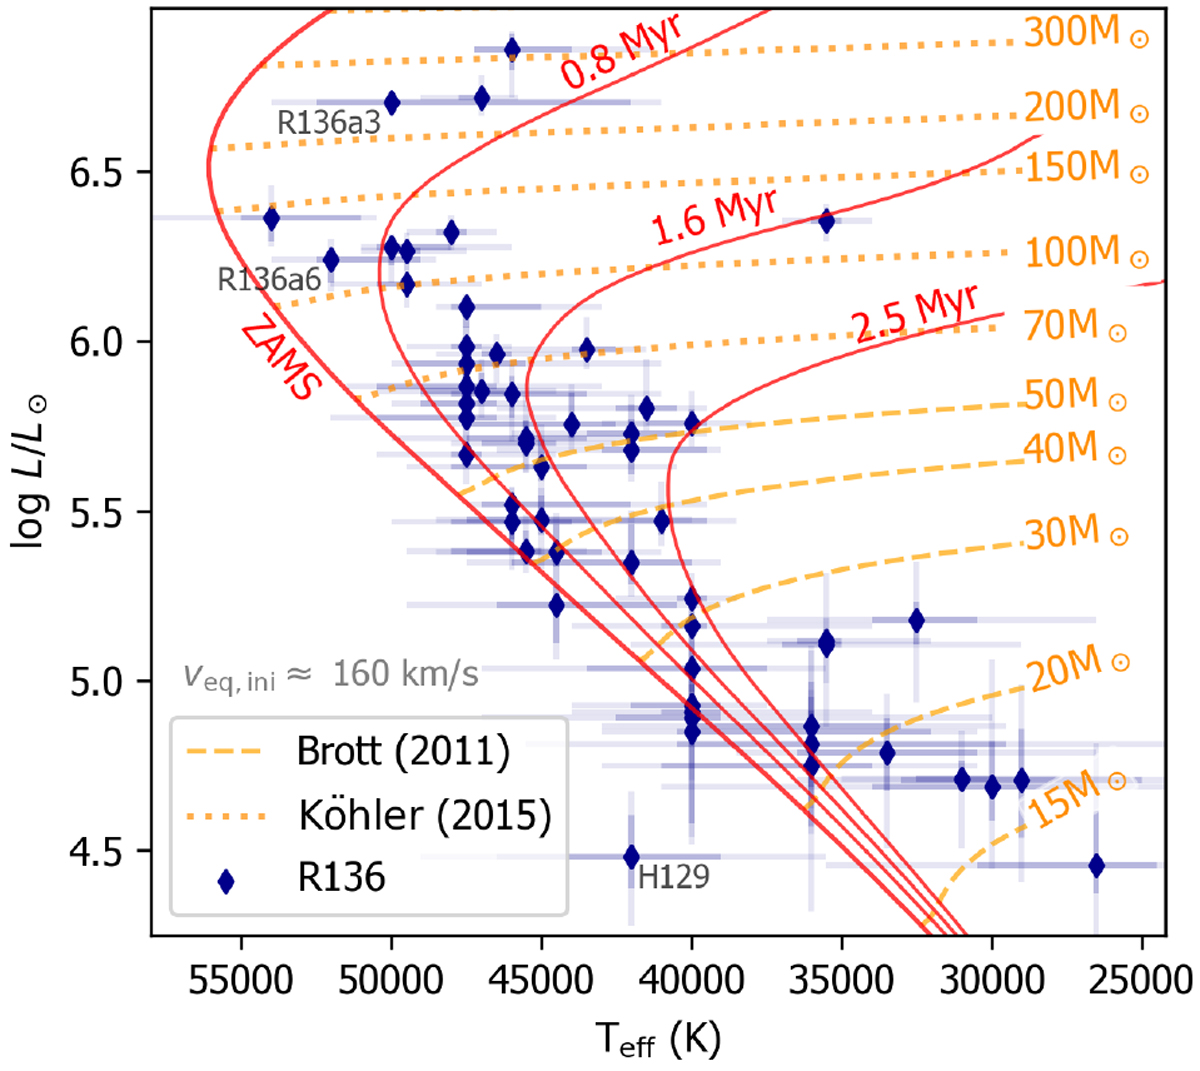
Positions of the R136 sources (optical + UV analysis, dark blue points) in the Hertzsprung-Russell diagram. Yellow dashed and dotted yellow lines are LMC evolutionary tracks of Brott et al. (2011a) and Köhler et al. (2015), respectively. Red solid lines are isochrones. All tracks have an initial rotation of ≈160 km s−1, representative for the O-stars in the sample. We note that the tracks shown in Fig. 17 have a higher initial rotation.
Current usage metrics show cumulative count of Article Views (full-text article views including HTML views, PDF and ePub downloads, according to the available data) and Abstracts Views on Vision4Press platform.
Data correspond to usage on the plateform after 2015. The current usage metrics is available 48-96 hours after online publication and is updated daily on week days.
Initial download of the metrics may take a while.