Fig. 1
Download original image
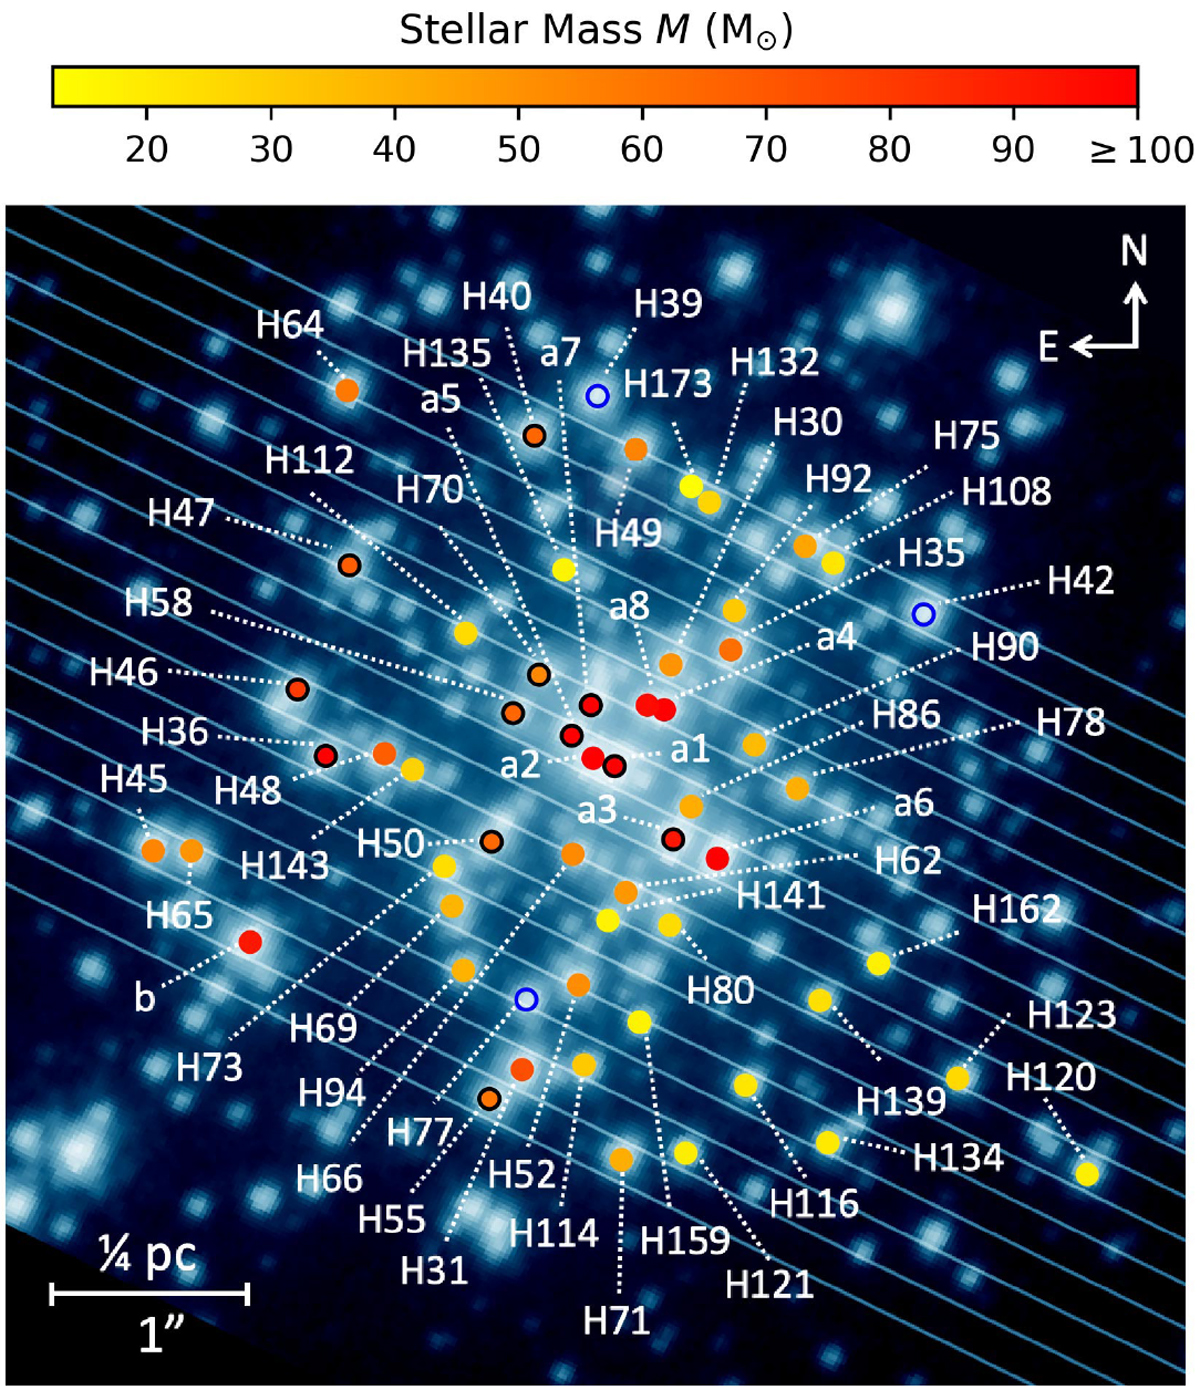
HST/WFC3 V-band (F555W) photometry of the core of R136 (O'Connell 2010). Positions of the stars in our sample are indicated (yellow to red closed circles) with respect to the slits of the HST/STIS observations (light blue lines). The colour of the circles indicates the current (evolutionary) mass of each source as derived in this paper. Identifications starting with ‘H’ from Hunter et al. (1995); those starting with ‘a’ and ‘b’ from Weigelt & Baier (1985). H68 and H129 (located 4.61′′ and ~4.10′′ from a1, respectively) are part of our sample but fall outside the region shown here. Three stars identified here (blue open circles) are not in our sample: H42 and H77 (SB2s), and H39 (analysed in de Koter et al. 1998, outside our slit coverage). Twelve stars of our sample overlap with that of de Koter et al. (1997, 1998, black open circles). Not indicated in the image are H17, north of a1, and the two components of a6, H19 (north) and H26 (south); see Sect. 2.1 for more details.
Current usage metrics show cumulative count of Article Views (full-text article views including HTML views, PDF and ePub downloads, according to the available data) and Abstracts Views on Vision4Press platform.
Data correspond to usage on the plateform after 2015. The current usage metrics is available 48-96 hours after online publication and is updated daily on week days.
Initial download of the metrics may take a while.