Fig. 9.
Download original image
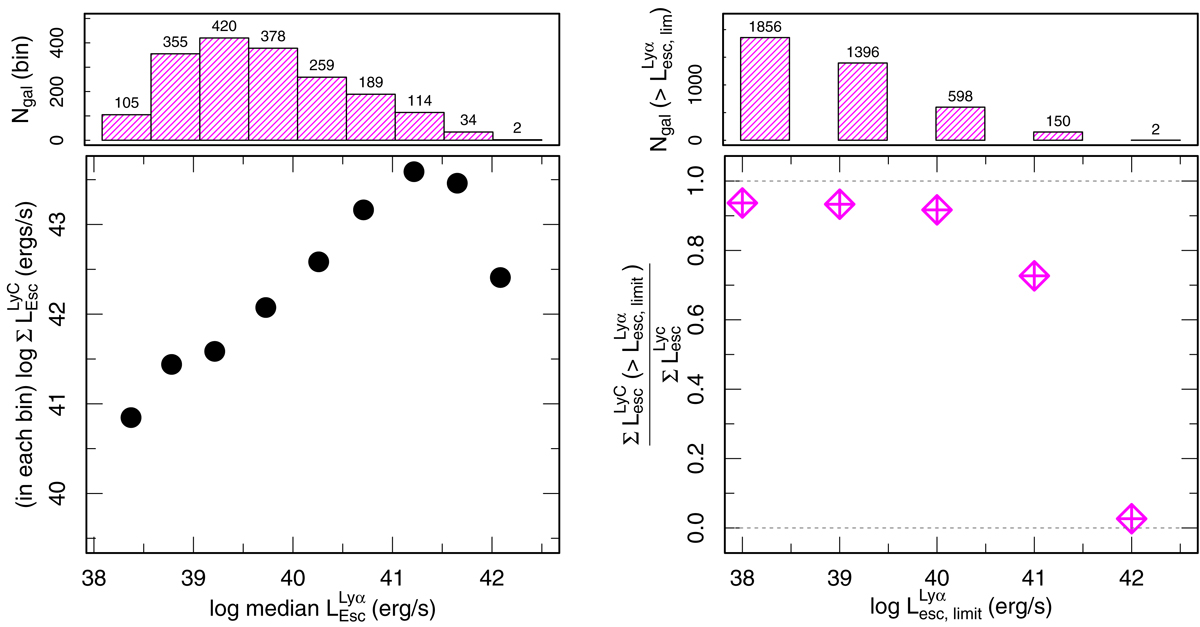
Total escaping ionizing luminosity of LAEs. Left: total escaping LyC luminosity of galaxies grouped by their Lyα luminosities as a function of their median Lyα luminosity. The histogram above shows the number of galaxies in the corresponding bins below. Right: conditional total escaping LyC luminosity of galaxies brighter than a given Lyα luminosity limit as a function of the Lyα luminosity limit. The histogram above indicates the number of galaxies where ![]() is greater than the respective Lyα luminosity limits below, so these are the numbers of galaxies that have been used to calculate the respective fractions.
is greater than the respective Lyα luminosity limits below, so these are the numbers of galaxies that have been used to calculate the respective fractions.
Current usage metrics show cumulative count of Article Views (full-text article views including HTML views, PDF and ePub downloads, according to the available data) and Abstracts Views on Vision4Press platform.
Data correspond to usage on the plateform after 2015. The current usage metrics is available 48-96 hours after online publication and is updated daily on week days.
Initial download of the metrics may take a while.