Fig. 7.
Download original image
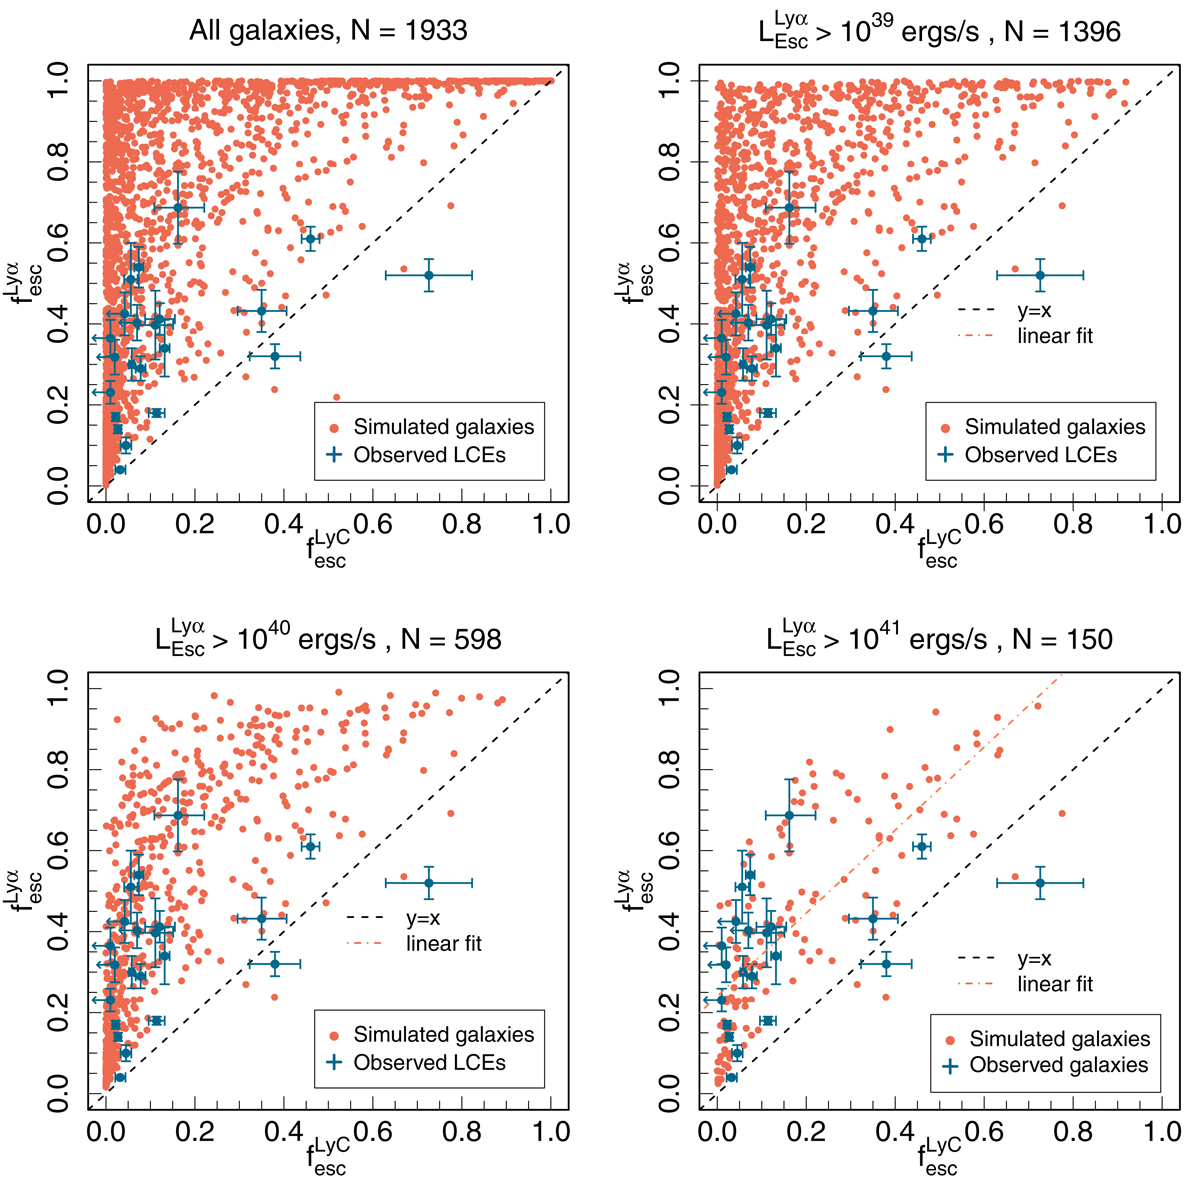
Escape fractions of Lyα vs. LyC. The plots here show progressively brighter sample selection for all galaxies (top left) and galaxies with ![]() erg (top right),
erg (top right), ![]() erg (bottom left), and
erg (bottom left), and ![]() erg (bottom right). In each plot we include the
erg (bottom right). In each plot we include the ![]() and
and ![]() of observed LCEs from Table 1 (blue points) with their error bars. The observed LCEs are all bright in Lyα, with
of observed LCEs from Table 1 (blue points) with their error bars. The observed LCEs are all bright in Lyα, with ![]() erg s−1. For a few galaxies, the observed
erg s−1. For a few galaxies, the observed ![]() is an upper limit; these galaxies are marked by blue arrows. The dashed black line shows the y = x, or equality, line. The dashed orange line in the bottom-right plot shows a linear fit of the simulated galaxies, which yields a slope of 1.02. This plot shows that if we include all galaxies, including very faint ones,
is an upper limit; these galaxies are marked by blue arrows. The dashed black line shows the y = x, or equality, line. The dashed orange line in the bottom-right plot shows a linear fit of the simulated galaxies, which yields a slope of 1.02. This plot shows that if we include all galaxies, including very faint ones, ![]() and
and ![]() are very scattered and not correlated, but as we restrict our sample to progressively brighter LAEs, a correlation emerges. Bottom-right panel: simulated galaxies are in the same luminosity range as the observed ones (> 1041 erg s−1), and the two groups show similar correlations.
are very scattered and not correlated, but as we restrict our sample to progressively brighter LAEs, a correlation emerges. Bottom-right panel: simulated galaxies are in the same luminosity range as the observed ones (> 1041 erg s−1), and the two groups show similar correlations.
Current usage metrics show cumulative count of Article Views (full-text article views including HTML views, PDF and ePub downloads, according to the available data) and Abstracts Views on Vision4Press platform.
Data correspond to usage on the plateform after 2015. The current usage metrics is available 48-96 hours after online publication and is updated daily on week days.
Initial download of the metrics may take a while.