Fig. 5.
Download original image
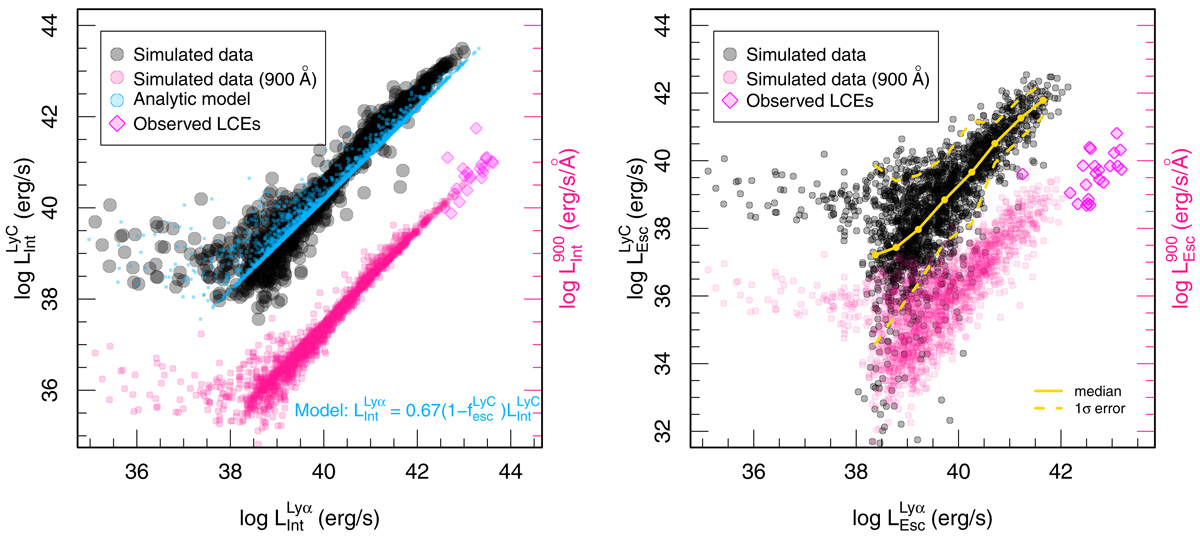
LyC luminosity of galaxies as a function of their Lyα counterparts. Left: intrinsic LyC luminosity of galaxies as a function of their intrinsic Lyα luminosity. The black and pink points show the total LyC luminosity (0–912 Å) and the 900 Å luminosity of the simulated galaxies, respectively (Sect. 3.1). The diamond-shaped magenta points show the observed LCEs described in Table 1. The sky blue points show the intrinsic luminosities derived from the analytic model described in this panel. Right: escaping LyC luminosity of galaxies as a function of their escaping Lyα luminosity. The solid yellow line shows the median ![]() as a function of
as a function of ![]() (we divide the log
(we divide the log ![]() between 38 and 42 into groups of 0.5 dex each and find the median luminosities). The dashed lines show the 1σ deviation from this, which illustrates the typical dispersion of the escaping luminosities.
between 38 and 42 into groups of 0.5 dex each and find the median luminosities). The dashed lines show the 1σ deviation from this, which illustrates the typical dispersion of the escaping luminosities.
Current usage metrics show cumulative count of Article Views (full-text article views including HTML views, PDF and ePub downloads, according to the available data) and Abstracts Views on Vision4Press platform.
Data correspond to usage on the plateform after 2015. The current usage metrics is available 48-96 hours after online publication and is updated daily on week days.
Initial download of the metrics may take a while.