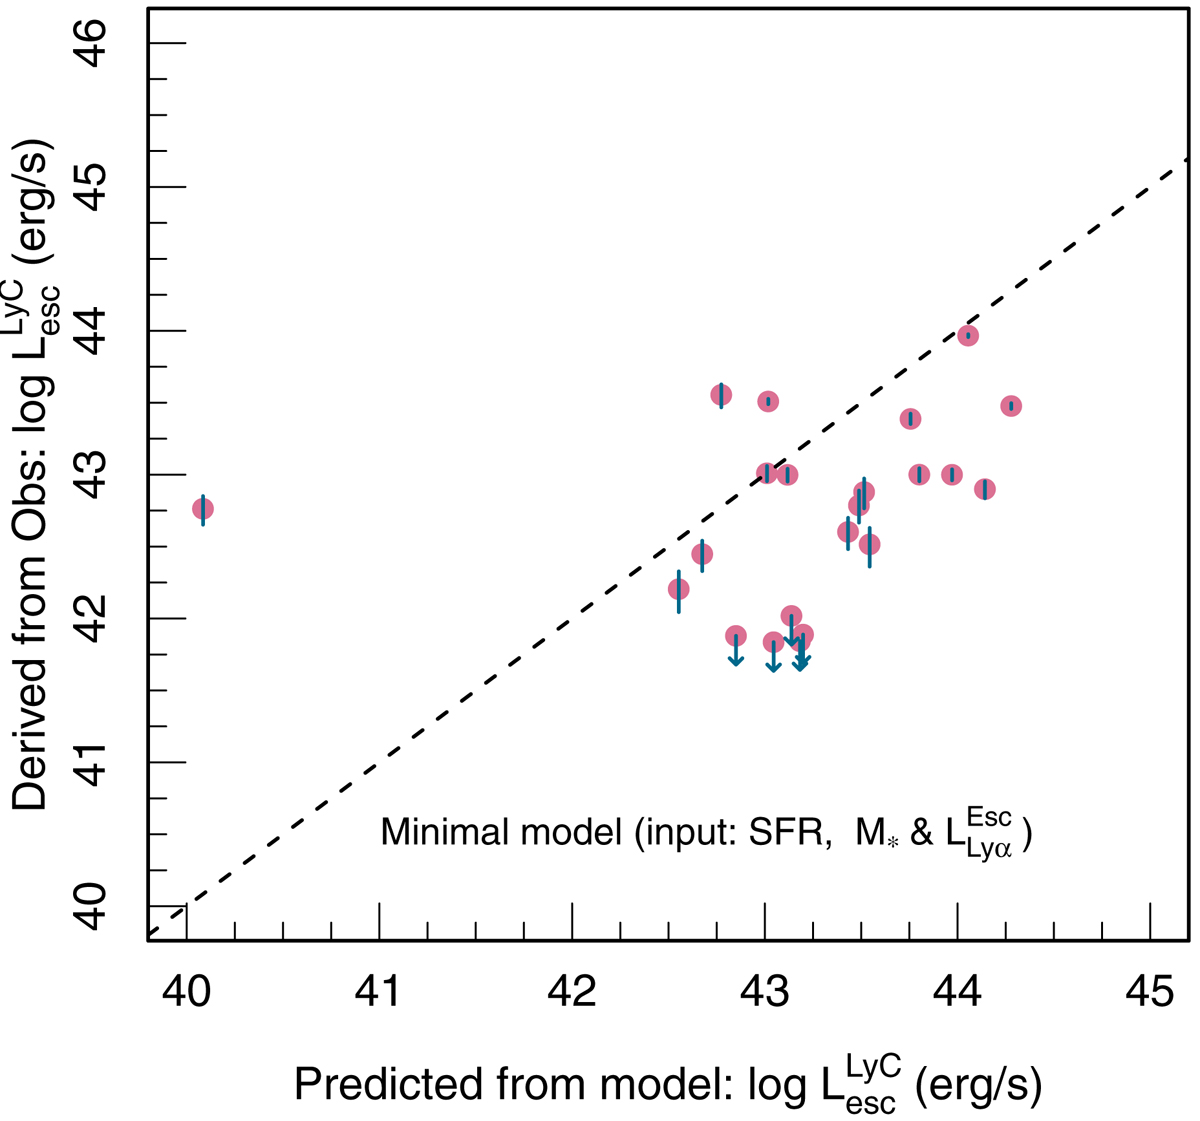
Fig. 12.
Download original image
Predicted ![]() from the minimal model (Model 3, described in Sect. 4.2.3) vs. the
from the minimal model (Model 3, described in Sect. 4.2.3) vs. the ![]() derived from observations for the observed LCEs listed in Table 1. The values on the y axis are derived by multiplying the observed
derived from observations for the observed LCEs listed in Table 1. The values on the y axis are derived by multiplying the observed ![]() by the ratio
by the ratio ![]() /
/![]() derived from our simulation (Sect. 2.3). The observational luminosity error bars are shown in sky blue. For a few galaxies, the observed
derived from our simulation (Sect. 2.3). The observational luminosity error bars are shown in sky blue. For a few galaxies, the observed ![]() is an upper limit; they are marked by sky blue arrows.
is an upper limit; they are marked by sky blue arrows.
Current usage metrics show cumulative count of Article Views (full-text article views including HTML views, PDF and ePub downloads, according to the available data) and Abstracts Views on Vision4Press platform.
Data correspond to usage on the plateform after 2015. The current usage metrics is available 48-96 hours after online publication and is updated daily on week days.
Initial download of the metrics may take a while.