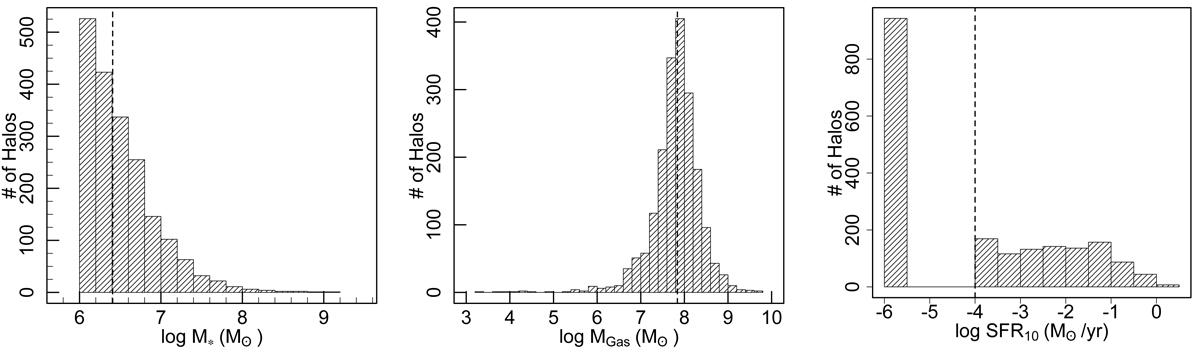
Fig. 1.
Download original image
Histograms of physical properties of the simulated galaxies in our sample. The histograms show the distribution of the stellar mass (left), gas mass (middle), and SFR10 (right) of the galaxies. The median values are shown by dashed black lines. The stellar mass histogram shows M⋆ within 30% of the halo virial radius. There are ten galaxies with M⋆ > 108 M⊙. The gas mass has a peaked distribution, with a few galaxies having very little gas (further discussion in Sect. 5). There are 943 galaxies with zero SFR10; these galaxies are represented in the bar at 10−6 (discussed in Sect. 4.2.1).
Current usage metrics show cumulative count of Article Views (full-text article views including HTML views, PDF and ePub downloads, according to the available data) and Abstracts Views on Vision4Press platform.
Data correspond to usage on the plateform after 2015. The current usage metrics is available 48-96 hours after online publication and is updated daily on week days.
Initial download of the metrics may take a while.