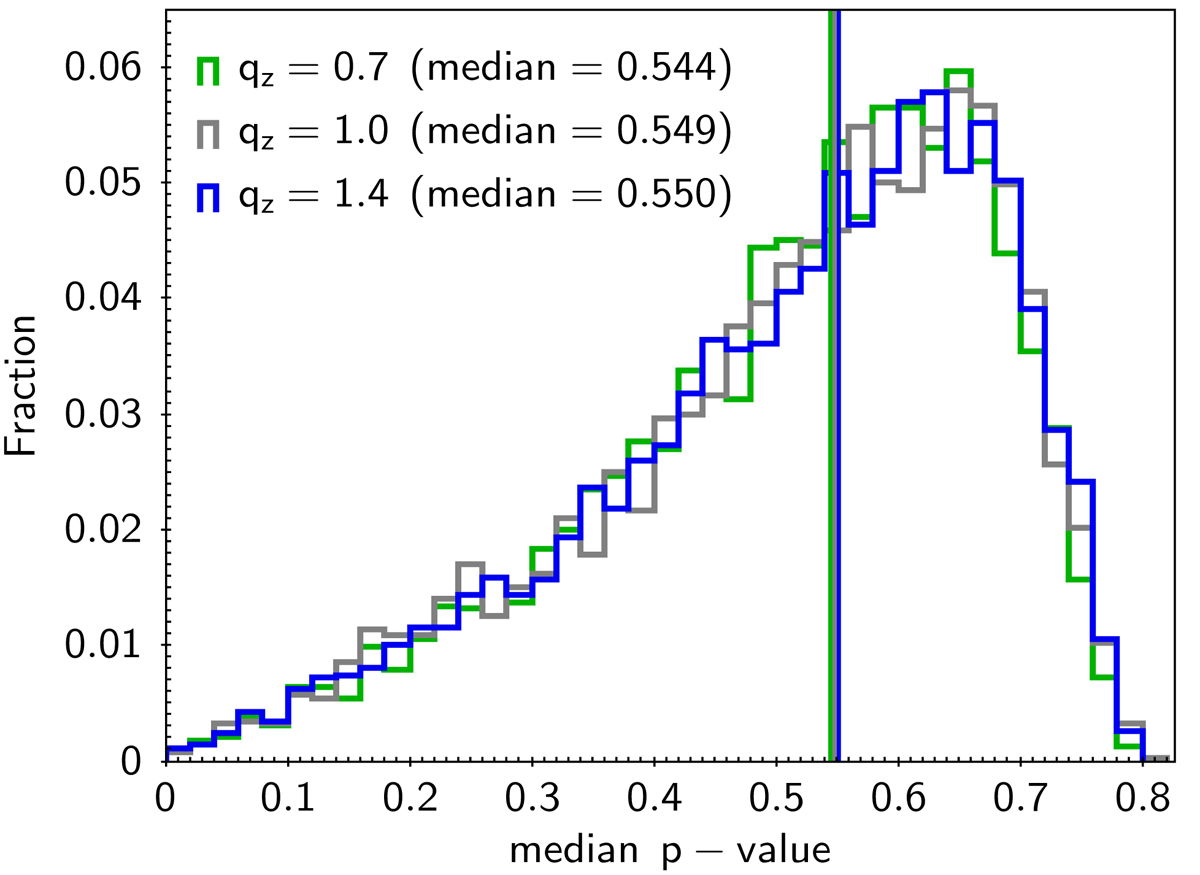
Fig. 9.
Download original image
Distribution of the median p-values obtained from the KS test comparison of ![]() from all possible observed samples against the Dω’s from mock catalogs B generated in the same DM halo; the DM halo is spherical (gray histogram) or spheroidal with axis of symmetry about the z axis with an oblate (qz = 0.7; green histogram) or prolate (qz = 1.4; blue histogram) shape. The solid gray, green, and blue lines are the medians of the corresponding distributions.
from all possible observed samples against the Dω’s from mock catalogs B generated in the same DM halo; the DM halo is spherical (gray histogram) or spheroidal with axis of symmetry about the z axis with an oblate (qz = 0.7; green histogram) or prolate (qz = 1.4; blue histogram) shape. The solid gray, green, and blue lines are the medians of the corresponding distributions.
Current usage metrics show cumulative count of Article Views (full-text article views including HTML views, PDF and ePub downloads, according to the available data) and Abstracts Views on Vision4Press platform.
Data correspond to usage on the plateform after 2015. The current usage metrics is available 48-96 hours after online publication and is updated daily on week days.
Initial download of the metrics may take a while.