Fig. 8.
Download original image
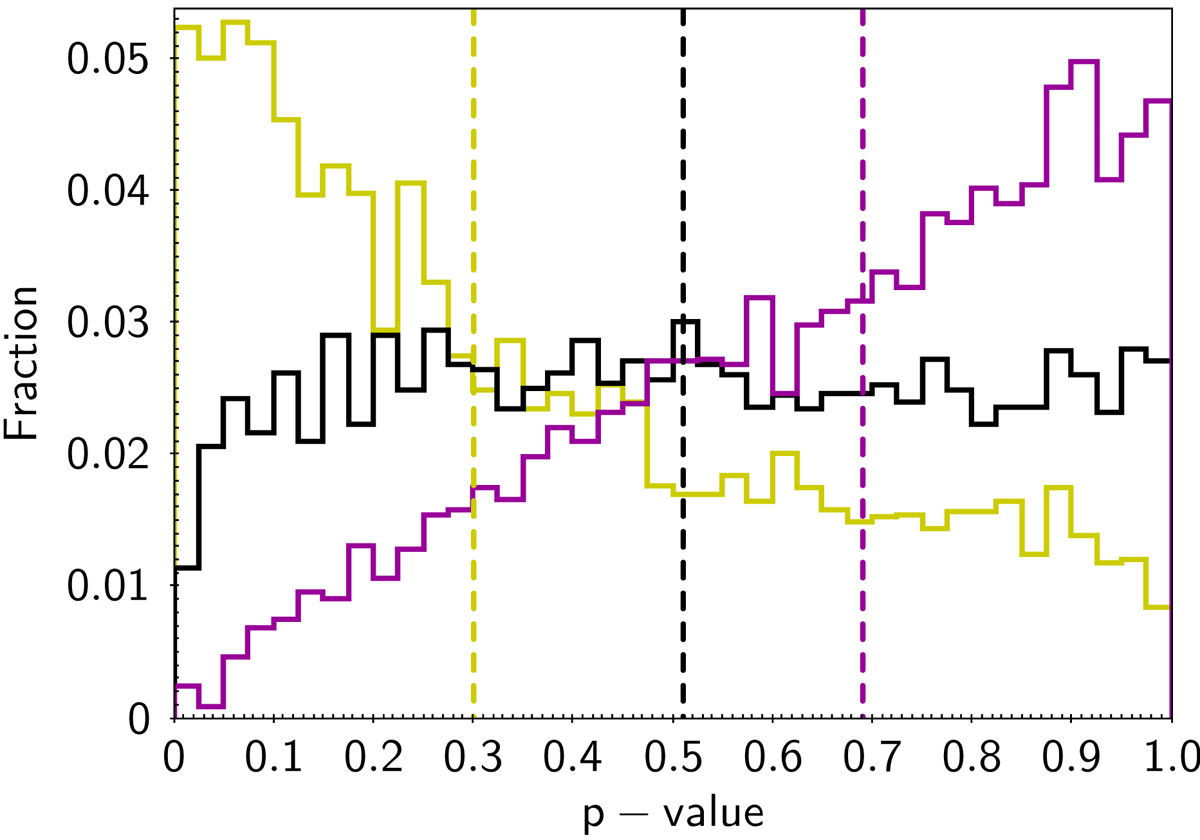
Distributions of the p-values obtained by comparing ![]() from each of n = 3 observed samples of HVSs against the Dω’s of a series of nt = 5000 mock samples. The observed samples and the mock samples have all crossed a spherical DM halo. The black histogram shows an approximately uniform distribution of p, with a median value pmed ≃ 0.5; the olive histogram shows the case of a skewed distribution with pmed ≃ 0.3; the purple histogram shows the case of a skewed distribution with pmed ≃ 0.7. The median p-values of the three distributions are marked by the vertical dashed lines.
from each of n = 3 observed samples of HVSs against the Dω’s of a series of nt = 5000 mock samples. The observed samples and the mock samples have all crossed a spherical DM halo. The black histogram shows an approximately uniform distribution of p, with a median value pmed ≃ 0.5; the olive histogram shows the case of a skewed distribution with pmed ≃ 0.3; the purple histogram shows the case of a skewed distribution with pmed ≃ 0.7. The median p-values of the three distributions are marked by the vertical dashed lines.
Current usage metrics show cumulative count of Article Views (full-text article views including HTML views, PDF and ePub downloads, according to the available data) and Abstracts Views on Vision4Press platform.
Data correspond to usage on the plateform after 2015. The current usage metrics is available 48-96 hours after online publication and is updated daily on week days.
Initial download of the metrics may take a while.