Fig. 16.
Download original image
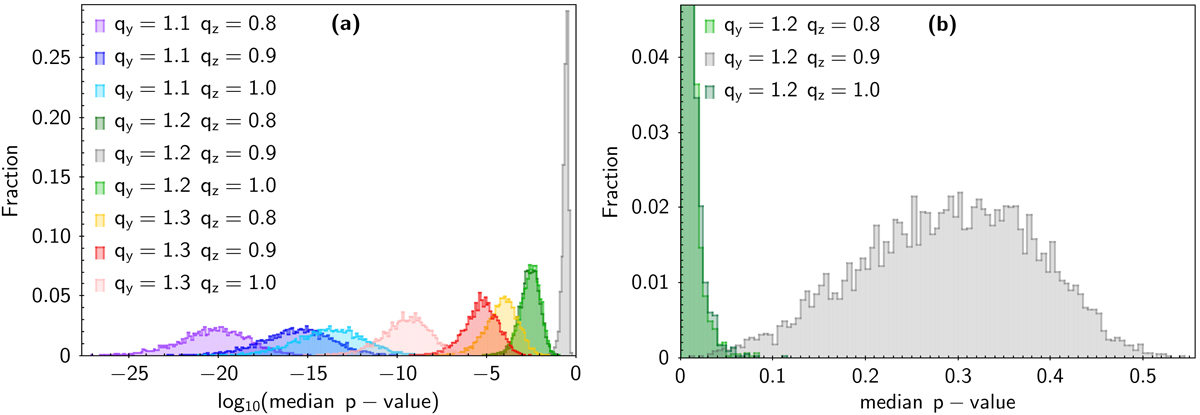
Distributions of the median p-values for an HVS observed sample that crossed a triaxial DM halo. Panel a: distributions of the median p-values, pmed (in logarithmic scale), obtained from the 2D KS test comparison of the HVS observed sample against a selection of nine of the ns = 56 ensembles of mock HVS samples generated in DM halos with different triaxiality parameters. Each distribution is the result of the 2D KS test comparisons of the ![]() ’s of the n = nt = 5000 observed samples obtained in a DM halo with qy = 1.2 and qz = 0.9 against the nt mock samples generated in a DM halo with a different shape, as listed in the panel. Panel b: enlargement of the rightmost part of panel a, with the pmed axis in linear scale. The green and dark green distributions are the only distributions with non-null overlap with the gray distribution. The different shapes of the distributions in panels a and b are due to the different size of the histogram bins in the logarithmic and linear scales.
’s of the n = nt = 5000 observed samples obtained in a DM halo with qy = 1.2 and qz = 0.9 against the nt mock samples generated in a DM halo with a different shape, as listed in the panel. Panel b: enlargement of the rightmost part of panel a, with the pmed axis in linear scale. The green and dark green distributions are the only distributions with non-null overlap with the gray distribution. The different shapes of the distributions in panels a and b are due to the different size of the histogram bins in the logarithmic and linear scales.
Current usage metrics show cumulative count of Article Views (full-text article views including HTML views, PDF and ePub downloads, according to the available data) and Abstracts Views on Vision4Press platform.
Data correspond to usage on the plateform after 2015. The current usage metrics is available 48-96 hours after online publication and is updated daily on week days.
Initial download of the metrics may take a while.