| Issue |
A&A
Volume 663, July 2022
|
|
|---|---|---|
| Article Number | A129 | |
| Number of page(s) | 22 | |
| Section | Extragalactic astronomy | |
| DOI | https://doi.org/10.1051/0004-6361/202142665 | |
| Published online | 20 July 2022 | |
Observing the inner parsec-scale region of candidate neutrino-emitting blazars
1
Dipartimento di Fisica e Astronomia, Università di Bologna, via Gobetti 93/2, 40129 Bologna, Italy
e-mail: This email address is being protected from spambots. You need JavaScript enabled to view it.
2
Istituto Nazionale di Astrofisica, Istituto di Radioastronomia (IRA), via Gobetti 101, 40129 Bologna, Italy
3
Instituto de Astrofísica de Andalucía (CSIC), Glorieta de las Astronomía, s/n, 18008 Granada, Spain
4
Deutsches Elektronen-Synchrotron, 15738 Zeuthen, Germany
5
Institut für Theoretische Physik und Astrophysik, Universität Würzburg, Emil-Fischer-Str. 31, 97074 Würzburg, Germany
6
Max-Planck-Institut für Radioastronomie, Auf dem Hügel 69, 53121 Bonn, Germany
7
Key Laboratory of Radio Astronomy, Shanghai Astronomical Observatory, Chinese Academy of Sciences, 80 Nandan Road, Shanghai 200030, PR China
8
Korea Astronomy and Space Science Institute, 776 Daedeok-daero, Yuseong-gu, Daejeon 34055, Korea
Received:
15
November
2021
Accepted:
23
March
2022
Abstract
Context. Many questions concerning the nature of astrophysical counterparts of high-energy neutrinos remain unanswered. There is increasing evidence of a connection between blazar jets and neutrino events, with the flare of the γ-ray blazar TXS 0506+056 in spatial and temporal proximity of IC 170922A representing one of the most outstanding associations of high-energy neutrinos with astrophysical sources reported so far.
Aims. With the purpose of characterising potential blazar counterparts to high-energy neutrinos, we analysed the parsec-scale regions of γ-ray blazars in spatial coincidence with high-energy neutrinos, detected by the IceCube Observatory. Specifically, we intended to investigate peculiar radio properties of the candidate counterparts related to the neutrino production, such as radio flares coincident with the neutrino detection or features in jet morphology (limb brightening, transverse structures).
Methods. We collected multi-frequency, very-long-baseline interferometry (VLBI) follow-up observations of candidate counterparts of four high-energy neutrino events detected by IceCube between January 2019 and November 2020, with a focus on γ-ray-associated objects. We analysed their radio characteristics soon after the neutrino arrival in comparison with archival VLBI observations and low-frequency radio observations. We discussed our results with respect to previous statistical works and studies on the case of TXS 0506+056.
Results. We identified and analysed five potential neutrino-emitting blazars in detail. Our results suggest an enhanced state of activity for one source, PKS 1725+123. However, the lack of adequate monitoring prior to the neutrino events was a limitation in tracing radio activity and morphological changes in all the sources.
Conclusions. We suggest that PKS 1725+123 is a promising neutrino source candidate. For the other sources, our results alone do not reveal a strong connection between the radio activity state at the neutrino arrival. A larger number of VLBI and multi-wavelength follow-up observations of neutrino events are now essential to our understanding of the neutrino production mechanisms in astrophysical sources.
Key words: galaxies: jets / galaxies: active / BL Lacertae objects: general / neutrinos
© ESO 2022
1. Introduction
The detection of the first neutrinos with PeV energy (IceCube Collaboration 2013; Aartsen et al. 2013) has revived the long-standing debate about the possible production site of these high-energy particles. Because energetic neutrinos are isotropically distributed across the sky (Aartsen et al. 2014), extragalactic sources are the first natural electromagnetic counterparts to look at. Emission of γ-rays is also expected in neutrino production chains. However, the sub-degree or degree angular resolution of current γ-ray and neutrino detectors usually prevents unambiguous identification of the neutrino γ-ray counterpart. Since the extragalactic GeV-TeV population is dominated by a class of active galactic nuclei (AGN), the blazars (Ackermann et al. 2015), these have been extensively studied as the main contributors to the astrophysical neutrino flux. So far, we know from stacking analysis that the population of γ-ray blazars should contribute no more than 27% of the diffuse neutrino flux (Aartsen et al. 2017).
Blazars are radio-loud AGN with a relativistic jet aligned with the observer’s line of sight (Urry & Padovani 1995). Their strong outflow radiates over the entire electromagnetic spectrum, from the radio band to γ-rays. The emission from blazar jets is enhanced and blueshifted due to relativistic effects and is characterised by a two-hump spectral energy distribution (SED). The interaction between relativistic electrons and the magnetic field within the jet produces synchrotron emission at low frequencies, with a peak between ∼1012.5 Hz and ∼1018.5 Hz (Giommi et al. 2012). The peak of the high-energy emission is observed between ∼1020 Hz and ∼1026 Hz (Giommi et al. 2012). Both inverse Compton (IC) and hadronic processes are capable of describing this second bump, but hybrid lepto-hadronic mechanisms have also been proposed (e.g., Böttcher 2019). In particular, neutrinos are also produced in hadronic processes.
Based on their optical properties, blazars are divided into flat-spectrum radio quasars (FSRQs), which have strong emission lines from clouds around the AGN accretion disc (called the broad line region, BLR) and BL Lacs (BLLs), which have weak emission lines or completely featureless optical spectra. According to the position of the synchrotron emission peak, νpeak, blazars are also divided into the following categories: low synchrotron peaked (LSP, or low peaked BLL, LBL, relative to BLLs, νpeak < 1014 Hz), intermediate synchrotron peaked (ISP or IBL, 1014 Hz < νpeak < 1015 Hz), and high synchrotron peaked (HSP or HBL, νpeak > 1015 Hz) (Abdo et al. 2010).
Relativistic jets of blazars represent the ideal particle accelerators in which high-energy neutrinos could be products of highly accelerated protons interacting with the environment (e.g., Mannheim 1995). This theoretical expectation was successfully confirmed in 2017, when it was identified as the first (and so far only) significant evidence for a blazar-neutrino association. The IceCube-170922A (IC 170922A) event, detected with an energy of 290 TeV and a high probability of being of astrophysical origin, was found in spatial coincidence with the blazar TXS 0506+056 and in temporal coincidence with a γ-ray flare from this source, detected by the Fermi gamma-ray space telescope and the MAGIC telescopes (IceCube Collaboration 2018). The multi-wavelength campaign, which began after the discovery of the neutrino and the γ-ray flare, showed that TXS 0506+056 emission increased in all bands of the electromagnetic spectrum, including the radio band.
A neutrino event was previously tentatively associated with the bright γ-ray flaring blazar PKS B1424-418 (Kadler et al. 2016). Unfortunately, due to the large angular uncertainty in the neutrino position (∼15°–20°), the association of PKS B1424-418 with the neutrino event is statistically less robust than in the case of IC 170922A (detected within a 90% error region of less than 1°, IceCube Collaboration 2018). Recently, Franckowiak et al. (2020) and Rodrigues et al. (2021) identified a promising connection between the FSRQ PKS 1502+106 and the IC 190730A event. This source was also found in a high state in the radio band and in a low state at γ-rays (Kun et al. 2021). The possible explanations on the neutrino production arising from these few observational hints are still incomplete and require further investigations of the possible neutrino counterparts.
Very-long-baseline interferometric (VLBI) observations played a crucial role in modelling the neutrino production mechanism in TXS 0506+056. The milliarcsecond (mas) angular resolution achievable with VLBI provides a unique tool to penetrate deep into the parsec scale of the jets. This is the site where particle acceleration is expected and where radio flares typically originate. Using VLBI archival and post-event data of TXS 0506+056, Ros et al. (2020) showed that a rapid expansion of the radio core occurred after the neutrino detection. They also interpreted the limb brightening in the jet of TXS 0506+056 as a sign of transverse velocity structure. This reinforced the idea of a connection with the neutrinos production given the considerations from previous theoretical studies (e.g., Tavecchio et al. 2014). Li et al. (2020) highlighted a decrease of the magnetic field strength in the VLBI core of TXS 0506+056, inferred from the core shift and variability analysis. They suggested that the lower value of magnetic field strength after the neutrino detection could be linked to the conversion of magnetic energy density to particle energy density. All these features observed in the parsec-scale region of TXS 0506+056 can be framed in the scenario of this source as the emitter of IC 170922A.
Moreover, population studies carried out with VLBI data by Plavin et al. (2020, 2021) suggested a correlation between bright VLBI sources and IceCube neutrino events. In particular, they stressed the fact that the region of neutrino production lies at the base of the jet, which is only reachable by the high-resolution VLBI observations. Plavin et al. (2020, 2021) performed the same statistical analysis with low-resolution radio data of a sample of non-VLBI-selected sources, finding no evidence of a connection between radio emission and neutrino events.
To explore the association between blazars and neutrinos, we investigated candidate blazar-like neutrino counterparts. In this work, we present high-resolution multi-frequency VLBI follow-ups dedicated to four high-energy neutrino events among those occurring between 2019 and 2020. In particular, due to the considerations in favour of a connection between neutrino events and γ-ray emission, as in the case of TXS 0506+056, we focused on radio counterparts of γ-ray blazars close to the neutrino event, most of them lying within the 90% event error region. Adopting this approach, we attempted to determine if recurring morphological and evolution radio properties, such as the one observed in TXS 0506+056, emerge in γ-ray blazars in spatial coincidence with neutrino emission.
This paper is organised as follows. We first introduce the four neutrino events and the candidate counterparts in Sect. 2. The VLBI observations are presented in Sect. 3, and the results and analysis of the observations are given in Sect. 4. We discuss our findings in Sect. 5 and conclude in Sect. 6. In Appendix A, we briefly present results on observed sources, which are less favoured neutrino candidates according to our discussion. Throughout this paper, we assume a ΛCDM cosmology with H0 = 70 km s−1 Mpc−1, ΩM = 0.3 and ΩΛ = 0.7.
2. IceCube neutrino events
In 2016, the IceCube Neutrino Observatory started a real-time alert programme that releases public notifications on high-energy neutrino detections. These are collected in the gamma-ray burst (GRB) Coordinates Network (GCN) Circulars Archive1. The aim is to inform the astronomical community in a timely fashion in order to obtain multi-wavelength data coincident in time and position with the neutrino arrival. Between July 2019 and November 2020, we performed VLBI follow-up observations of four IceCube neutrino alerts.
Considering the large uncertainties on the associations between neutrinos and astrophysical sources and the limited sample of neutrino events collected by the IceCube detector every year, we decided to not apply stringent criteria on which events (and relative candidate counterparts) to follow. The intent of our study is rather to present new VLBI results on blazars as possible neutrino counterparts. We devoted follow-up observations to neutrino events that have piqued interest in the multi-messengers astronomy community. Most of the events have indeed been investigated with multi-wavelength follow-ups. In this context, the VLBI results presented in this work also have the aim of being complementary to other wavelength studies (e.g., de Menezes et al. 2021).
In Table 1, we report basic properties of the neutrino events. According to the most recent IceCube classification, neutrino detections are divided into gold or bronze class. Gold alerts are announced for high-energy neutrino track events that are at least 50% (on average) likely to be of astrophysical origin, while bronze alerts have a 30% probability2. We targeted two gold and two bronze events. Bronze events still belong to a sample of well-reconstructed neutrino events with an average likelihood of being of cosmic origin only 20% lower compared to the Gold sample. The two Bronze events presented in this work have indeed drawn attention based on the possible connection with astrophysical sources, as was the case in literature with previous detections showing similar likelihoods of astrophysical origin (e.g., the IC 41209A – GB6 J1040+0617 coincidence in Garrappa et al. 2019a).
Properties of IceCube neutrino events analysed in this work.
The energies of the neutrino events vary between ∼100 TeV and 375 TeV and the arrival localisation area spans from ∼4 to 27 square degrees (90% error region). Plavin et al. (2020) pointed out that the 90% error regions around the neutrinos’ best-fit positions published in the IceCube notifications do not take into account all the systematic errors, including, for example, the ones due to the non-trivial characterisation of the ice (inside which the IceCube detector operates). We did not include an estimation of these systematic errors to the published error regions (as Plavin et al. 2020 and others authors did).
The neutrino candidate counterparts targeted by our VLBI follow-ups are the ones that have been notified in the GCN circulars and in the Astronomer’s Telegrams3 (ATels) dedicated to the four events. This second network collects notices about follow-up observations (usually quickly triggered after the GCN alerts) of transient objects. In these follow-up campaigns the selection criteria were not uniquely established but rather defined on a one-by-one case. Our final sample partly reflects this all-encompassing approach and is admittedly formed by a heterogeneous collection, both in neutrino events and candidate counterparts. Also, in light of the possible underestimation of the localisation area, we observed sources outside the 90% error region when these are indicated as possible counterparts in the ATels.
Based on the scenario of a connection between neutrinos and γ-ray emission in blazars (e.g., IceCube Collaboration 2018; Kadler et al. 2016), among the candidates reported in the ATels that we observed, we primarily analysed those sources with a γ-ray association. For this reason, we gave priority to ATels published by the Fermi collaboration. The only exception was the case of the last event, IC 201114A, for which we also observed two non-γ-ray-associated sources as they are reported in the dedicated ATels. Each neutrino event has between 1 and 3 associated γ-ray sources, already catalogued or detected after the neutrino event with a dedicated analysis. Most of these are indeed part of the Fermi-LAT Fourth Source Catalogue (4FGL, Abdollahi et al. 2020) or its incremental version (4FGL-DR2, Abdollahi et al. 2020). The properties of the γ-ray candidate counterparts are summarised in Table 2. The two γ-ray sources, 4FGL J1114.6+1225 and 4FGL J1728.0+1216, lie outside the 90% error region of the IC 200109A and IC 201021A event, respectively. The first one, 4FGL J1114.6+1225, was initially identified as the possible counterpart of the neutrino event by Garrappa et al. (2020). The spatial coincidence of 4FGL J1728.0+1216 with IC 201021A was reported in the GCN circular 28715, sent by the IceCube Collaboration.
Properties of the candidate γ-ray counterparts for the neutrino events.
In Table 3, we report properties of the sources associated with the γ-ray ones. In the majority of the cases we used the association reported in the ATels and GCN circulars. For γ-ray sources already present in the Fermi catalogue, we verified that the counterparts proposed in the circulars coincide with the ones in the catalogue. Only in the case of 4FGL J1114.6+1225 is the association not reported in the ATEL; in this instance, we consulted the NASA/IPAC Extragalactic Database (NED), according to which the nearest source is the infrared object WISEA J111439.67+122503.7. We identified the possible radio counterpart of this in the Very Large Array (VLA) surveys (see the next section). In these surveys, we found a detection located at a distance of about 2 arcmin from the infrared position reported in the NED.
Information on other-wavelength associations with the candidate counterparts of neutrino events.
The classification of the associated sources listed in Table 3 (column 8) is retrieved from the Fermi catalogue. When this information is not present in the Fermi catalogue (in the case of new, non-catalogued, or without association sources), it is taken from the NED. In the context of blazars as neutrino-emitters, among the γ-ray-associated sources, we only analysed objects classified as BLL or FSRQ in detail. Sources that are not confirmed blazars (although they display some blazar-like features) are presented in Appendix A.
In Table 3 we also present the two non-γ-ray-associated sources (WISEA J065633.43+053922.7 and NVSS J065916+055252) that have been identified as possible neutrino counterparts in the ATels dedicated to the IC 201021A event (see Sect. 3 and Appendix A). Taking into account our focus on γ-ray-associated sources, we consider WISEA J065633.43+053922.7 and NVSS J065916+055252 as less favoured candidates because they are not associated with any γ-ray source. However, other studies (e.g., Plavin et al. 2020, 2021) argue for a direct connection between neutrinos and VLBI cores, independently of the γ-ray emission. Therefore, we also analyse and briefly discuss these two sources in Appendix A.
Throughout the paper, we refer to the radio counterpart of the sources listed in Table 3 with the name reported in that table.
3. Observations and data reduction
In order to investigate the radio structures and variability of the candidates, we analysed both VLBI datasets taken after the neutrino detection and archival data. Carried out over longer integration times and at different observing frequencies, our new multi-frequency VLBI observations allowed us to produce higher quality and higher fidelity images with respect to the available archival data of the targets. Moreover, some of them have never been observed at VLBI resolution before.
3.1. New VLBI data
The VLBI follow-up observations of the four events have been performed with the very-long baseline array (VLBA), the European VLBI network (EVN), and the e-MERLIN array. Details about the observations are listed in Table 4. Blazar sources are expected to experience variability in the radio emission at the GHz regime on timescales of several weeks (e.g., Orienti et al. 2013). Therefore, our VLBI observations were carried out with time gaps from the neutrino detection in the range of a few days to one month. The observation frequencies, from 1.5 GHz to 23.5 GHz, were selected to optimise the balance between sensitivity and resolution of the jet structure on different mas-scales. The total bandwidth ranges between 32 MHz, 64 MHz, and 128 MHz (until 512 MHz for the e-MERLIN array; see below). All the sources have been observed at least at two observing frequencies. Only in the cases of PKS 1725+123 and 1RXS J172314.4+142103 we obtained a single-frequency observation. The sensitivity levels of the images are between 20 μJy beam−1 and 100 μJy beam−1. The restoring beam sizes range from 0.8 mas to 12 mas in VLBA and EVN images and from 35 mas to 84 mas in e-MERLIN images. Antennas participating in the observations are reported in Table 4.
Summary of VLBI observations.
In processing all the raw VLBI data, we applied the standard approach of VLBI data reduction described in the NRAO Astronomical Image Processing System (AIPS, Greisen 2003) cookbook4, which includes visibility amplitude calibration, bandpass calibration, and phase calibration. This calibration procedure was carried out either with the AIPS software package or with the Common Astronomy Software Applications (CASA, McMullin et al. 2007). After these steps, we exported the single-source visibilities from AIPS or CASA and imported them into the DIFMAP software (Shepherd et al. 1994) for self-calibration and imaging. For the imaging, the DIFMAP software follows the CLEAN approach, which includes fitting Delta functions to the visibility data (Högbom 1974).
IC 190704A. The follow-up observations of the event were focused on the two candidates listed in Table 3: NVSS J104938+274212 and 1WHSP J104516.2+275133. The candidates were observed less than one month after the neutrino detection, on 2019 July 18 and 22, for a total 3 hours of observation at 1.5 GHz, 4.4 GHz, 7.6 GHz, and 8.4 GHz. We separately calibrated the datasets of the two days and then concatenated them into one. After a first inspection of the observation, we decided to dedicate a second, deeper observation (4 hours) only to the blazar-like source, 1WHSP J104516.2+275133 (see Sect. 4). This second observation was performed on 17 Jan. 2020 using the wide C band with two intermediate frequency bands (IFs; i.e. sub-bands) centred at 4.7 GHz and two IFs centred at 7.7 GHz. The calibrated data were split into two halves with one half containing the first two IFs and the other half containing the last two IFs. Due to the faintness of the targets and the uncertainties on their coordinates, the observations were performed adopting the phase-referencing mode. The phase-calibrator is a nearby bright FSRQ: J1037+2834 (B1034–2551, taken from the VLBA Calibrator Survey, VCS5). It is outside the 90% neutrino error region and it is not associated with γ-ray sources.
IC 200109A. The VLBA and EVN follow-up observations of the event included the four targets reported in Table 3. In particular, in spatial coincidence with 4FGL J1114.6+1225 (associated with WISEA J111439.67+122503.7), there are two possible radio counterparts. Throughout the course of the manuscript we refer to them using the name WISEA J111439.67+122503.7 followed by the suffixes A and B. The observation was carried out at 8.4 GHz and 23.5 GHz with the VLBA and at 4.9 GHz with the EVN. The position of the candidate TXS 1100+122 is constrained with a precision of the order of 0.1 mas (Kovalev et al. 2020b, coordinates from VCS). Also, it is bright enough to allow for fringe-fitting in the calibration procedures. Both EVN and VLBA data of the other two candidates, WISEA J111439.67+122503.7 and WISEA J105553.74+103446.5, were calibrated using TXS 1100+122.
IC 201021A. About 14 hours of e-MERLIN observing time was spent on the two possible IC 201021A counterparts: 1RXS J172314.4+142103 and PKS 1725+123. The e-MERLIN interferometer provides different total bandwidth and angular resolution than VLBA and EVN. The e-MERLIN observations were carried out at 5.1 GHz with a bandwidth of 512 MHz. The angular resolution of e-MERLIN, of the order of 30–80 mas, corresponds to larger linear scales with respect to VLBA and EVN ones.
Being a bright source, PKS 1725+123 was used as phase-reference calibrator.
The e-MERLIN data reduction was performed using the e-MERLIN CASA Pipeline v1.1.19 (Moldon 2021).
IC 201114A. The VLBA and EVN observations of IC 201114A candidate counterparts are described in Table 3. Since the most favoured candidate (see Sect. 4), NVSS J065844+063711, was known to be a faint radio source from Radio Fundamental Catalogue (RFC, described below) data, both VLBA and EVN observations were carried out in phase-referencing mode. NVSS J065916+055252, also identified as a possible radio counterpart of the neutrino event (Giommi et al. 2020b), is the phase calibrator for NVSS J065844+063711, with an offset of 1.6 degrees. The other candidate reported in Giommi et al. (2020b), WISEA J065633.43+053922.7, was included in the observation schedule as the check-source6 of the dataset.
3.2. Archival data
In addition to the proprietary data, we analysed archival VLBI data and publicly available surveys of larger scale data in order to have a more complete picture of the characteristics of the sources. Most of the archival VLBI data are retrieved from the RFC, which contains raw and calibrated data and images of thousands of sources. The RFC collects datasets of observations devoted to calibrator monitoring or astrometry experiments. Archival data of PKS 1725+123 used in this work are taken from the Monitoring Of Jets in Active galactic nuclei with VLBA Experiments (MOJAVE, Lister et al. 2018)7. Therefore, we explicitly refer to MOJAVE data in the case of PKS 1725+123. We re-imaged the available calibrated data from the RFC and MOJAVE with the DIFMAP software. The properties of the RFC and MOJAVE images are summarised in Table 5. The short observing duration of archival observations (of the order of minutes) results in a poorly sampled uv plane.
Properties of RFC and MOJAVE observations.
The arcsecond-scale extended emission of the sources was studied using VLA survey observations. A comparison between our VLBI data and information taken from VLA surveys helps to determine the nature of the targets, from mas- to arcsecond-scales. In particular, we retrieved the images of the targets from the NRAO VLA Sky Survey (NVSS; Condon et al. 1998), the Faint Images of the Radio Sky at Twenty-cm (FIRST; Becker et al. 1994) survey, and the VLA Sky Survey (VLASS; Lacy et al. 2020)8. The VLASS is an ongoing project and the final catalogue has not been released yet. The VLASS images taken from the CIRADA catalogue were produced using a simple imaging algorithm and no self-calibration was applied. This limits the accuracy of the results that we inferred from these images. The surveys are carried out at 1.4 GHz (NVSS and FIRST) and 3 GHz (VLASS). NVSS and FIRST images are characterised by a beam of 45″ × 45″ and 5.4″ × 5.4″, respectively, while the VLASS has a resolution of about 3″ × 2″. For some sources, the VLASS has two runs, denoted as 1.1 and 1.2 in Table 6. This table reports the properties of all the archival images.
Properties of NVSS, FIRST, and VLASS observations.
4. Analysis and results
4.1. Analysis methods
In Table 7, we list image parameters of the new VLBI data, using natural weighting. We measured the peak brightness, Speak, and the integrated flux density, Sint, of each target at each frequency. The latter was extracted from a polygonal area on the target images using the VIEWER tool of the CASA software. The area of extraction is the one above three-times the root-mean-square (rms) contour levels of the images. The rms was measured within an off-source region on the image plane. The uncertainties on Sν are given by
 (1)
(1)
Imaging parameters of VLBI observations.
where Nbeam is the number of beams of the area in which Sν is extracted. The error in the calibration procedure, σcal, is defined as σcal = ξ × Sν, in which we assumed ξ of the order of 10% for VLBA, EVN, and VLASS data and of the order of 5% for e-MERLIN, NVSS, and FIRST data. When the source is unresolved, we fitted the emission with a 2D Gaussian function with the imfit task in CASA. In this case, the uncertainties on the flux densities were estimated with the sum of squares of the fit error plus the calibration error. At the time of writing, we are aware of an issue with VLBA data taken starting from the first half of the 20199. The effects on the VLBA flux density scale of those data are currently under investigation. Our VLBA data at 23.5 GHz could be affected by this issue. While no standard procedure has so far been indicated by the National Radio Astronomy Observatory (NRAO) team, the help desk has suggested a test, the results of which reassure us about the applied analysis procedure. However, in this section and in Sect. 5 we briefly discuss the presence and the implications of additional errors in the flux density scales used.
The compactness of the sources can result in synchrotron self-absorption affecting the lower frequencies. Assuming S ∝ να, with α being the spectral index, we fitted two power laws for couples of adjacent frequencies to calculate the spectral index pattern over the sampled frequencies. The uncertainty of α is calculated based on the error propagation equation:
Before calculating the spectral index, both images at each frequency couple had been restored with the same uv-range, pixel size and restoring beam size and shape. We used the portion of uv-range covered by the observations at the two frequencies. Measurements of the spectral index are reported in Table 8.
Spectral index measured with VLBI data.
Following the case of TXS 0506+056 which significantly increased its radio emission during the neutrino event (Kun et al. 2019; Ros et al. 2020; Li et al. 2020), we searched for a similar behaviour in our sources. To quantitatively estimate the flux density variability for sources for which archival VLBI observations are available, we adopted the method used by Aller et al. (1992). This consists of calculating the variability index, V, with
 (2)
(2)
where Smax and Smin are the integrated flux densities of the higher and lower state and σSmax and σSmin are the associated uncertainties. According to Aller et al. (1992), a variability of the order of 10%, which corresponds to V ≥ 0.1, indicates a significant change in the flux density of the source. From the flux density data reported in Ros et al. (2020), we obtained V ∼ 0.1 in TXS 0506+056 over six months.
For those sources with a known redshift, z, we computed a radio luminosity based on the following formula:
where dL is the luminosity distance of the source. The luminosities reported in Table 9 were measured at around 1.4 GHz and at about 5 GHz. The spectral index α, adopted for the luminosity computation, is estimated between 1.4 GHz and 3 GHz data from the not simultaneous (separated by ∼20–25 yr) NVSS and VLASS.
Radio luminosity of the sources.
We characterised the jet emission of extended sources by fitting a 2D Gaussian function with the model-fit routine in the DIFMAP software. In this procedure, we fitted the visibility data with Gaussian model components. A good fit is achieved when σres = σcln ± 10%, where σres and σcln are, respectively, the rms noise level of the residual and the cleaned image. This ensures that the model components describe the jet structure well. We set the uncertainty associated with each component’s flux density as 10% of the flux density of the component itself. The precision associated with polar coordinates of the components, that is the radius and the position angle (PA), depends on the dimensions and the orientation of the image-restoring beam. We assumed that the component center lies within an ellipse oriented as the beam, and with the major and minor axis equal to the 10% of the beam ones. In some cases, it was necessary to fix the axis ratio or the position of the components (or both) to obtain a reliable fit (see, e.g., Table B.1).
4.2. Notes on individual neutrino events
IC 190704A. There are two possible γ-ray counterparts, J1049.8+2741 and J1045.3+2751, that are spatially coincident with IC 190704A. The former is a 4FGL γ-ray source without any associated low-energy counterpart (Table 2). The only radio source within its error ellipse is NVSS J104938+274212. Taking into account the unremarkable radio and optical properties of this source, we only observe it with a few scans. The resulting characteristics of this source are described in Appendix A.
The other γ-ray source, J1045.3+2751, was a new detection at the time of the follow-up campaign (Garrappa et al. 2019b) and was later included in the 4FGL-DR2 catalogue (Table 2). The possible counterpart is 1WHSP J104516.2+275133, which is at redshift 1.914 and classified as HBL (Arsioli et al. 2015; Chang et al. 2017). A possible connection between HBL sources and archival IceCube neutrino events have been suggested by Giommi et al. (2020a) and Padovani et al. (2022).
1WHSP J104516.2+275133 is unambiguously detected as a compact single component at all the frequency bands in the two epochs. Details of the radio images are listed in Table 7, and the total flux density at each frequency in the two epochs is shown in Fig. 1. To determine if the source underwent an increase of flux, we compared the VLBA integrated flux densities in the two epochs, measured at around 4 GHz and at 7.6 GHz using Eq. (2). The resulting variability index, V ∼ 0.03, between the epochs at both the frequencies implies that the source did not experience an increased radio activity after the neutrino detection. It was not possible to check the source’s long-term activity level because there were no archival RFC data available. The peak intensity and the total flux density are consistent with each other in both our observations, indicating that 1WHSP J104516.2+275133 is a compact source at VLBA-scales. By fitting the emission observed in the second epoch with an elliptical component using the imfit task, the major axis (deconvolved from the beam) turns out to be about 6 pc at 4.7 GHz and 7.6 GHz. In the first epoch, the dimensions of the source were not retrieved because it appears as point-like when deconvolved from the beam. From the 4.4 GHz imfit analysis we obtained an upper limit for the major axis ≤14 pc.
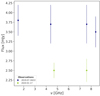 |
Fig. 1. 1WHSP J104516.2+275133 total radio flux density at different frequencies and epochs. |
The survey data at 1.4 GHz indicate that the source remains compact on arcsecond scales (Table 6). The comparison of arcsecond and mas-scales (even if not simultaneous) does not suggest the presence of any emission on intermediate scales. Carried out a month before the neutrino event, the VLASS observation recorded flux densities in agreement with the NVSS measurements, which were slightly lower than FIRST ones, though consistent within the uncertainties.
From our multi-frequency data, we were able to compute the synchrotron spectral indices of 1WHSP J104516.2+275133 which is ∼0.2 both between 1.5 GHz and 4.4 GHz and between 4.4 GHz and 7.6 GHz (Table 8). The compact structure of the source remains self-absorbed, at least until 7.6 GHz, in both epochs. Accounting for the source redshift, the radio luminosity is ∼4.2 × 1025 W Hz−1 at 4.4 GHz in the first epoch and ∼3.8 × 1025 W Hz−1 at 4.7 GHz in the second one (Table 9).
IC 200109A. Among the three candidate γ-ray counterparts of the gold event IC 200109A, the 4FGL catalogue reports highly statistically significant association for only one of them, J11103.0+1157, which is associated with the FSRQ TXS 1100+122. The other two γ-ray candidates, J1114.6+1225 and J1055.8+1034, can be spatially associated with WISEA J111439.67+122503.7 and WISEA J105553.74+103446.5, respectively. However, these associations are not confirmed by statistical arguments such as the likelihood ratio method adopted for source associations in the 4FGL (Abdollahi et al. 2020). WISEA J111439.67+122503.7 is located at about four degrees from the neutrino’s best-fit position, making its connection with the event less likely compared to the other two candidates. Moreover, both WISEA J111439.67+122503.7 and WISEA J105553.74+103446.5 are not classified as blazars or blazar candidates; thus, we present the VLBI analysis of those two targets in Appendix A, while in this section we focus on TXS 1100+122 which was immediately pointed out as potential neutrino source by Kovalev et al. (2020b). The final images for the VLBA and EVN observations of this source are shown in Fig. 2. The image parameters are listed in Table 7. The total flux density measured from our data with respect to the total flux density from RFC data can be seen in Fig. 3.
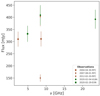 |
Fig. 2. TXS 1100+122 total radio flux density at different frequencies and epochs. |
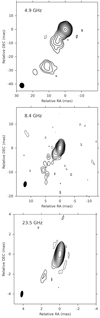 |
Fig. 3. EVN-4.9 GHz and VLBA-8.4 GHz and VLBA-23.5 GHz contour images of TXS 1100+122. The contour levels are drawn from 3 × the rms noise of the images. Contours increase by a factor of 2. The noise level and the beam size of each image are reported in Cols. 7 and 8 of Table 7. The black ellipse in the bottom left corner represents the restoring beam. |
An elongated structure extending towards the southeast is recognisable at all the observing frequencies. We modelled the source structure with Gaussian components with the model-fit procedure in DIFMAP for the new and archival VLBI observations. The properties of the components are reported in Table B.1. At each frequency, we fitted an elliptical or circular component representing the compact core emission. In addition to the core, five, six, and three other Gaussian models describe the 4.9 GHz, 8.4 GHz, and 23.5 GHz jet structure, respectively. The maximum elongation measured as the distance between the centre of the core component and the centre of the outermost component is about 255 pc, 150 pc, and 22 pc, at 4.9 GHz, 8.4 GHz, and 23.5 GHz, respectively (7.8 pc mas−1). The properties of the RFC observations are summarised in Table 5. The best-fit parameters of the components are reported in Table B.1. The model components identified in our observation are not clearly cross-identified in the RFC data. This can be due to either more than 10 years elapsed between the observations or the absence of intrinsically distinct compact regions in the jet or the different data quality. The absence of well-defined, compact components or stationary components (i.e. found at the same radius in different epochs) indicates that we are sampling a smooth, featureless, and quite homogeneous jet emission. The jet lies at a PA between ∼140 and 165 degrees (measured from north to east with respect to the image central pixel) and it does not show any bending. Only the last component identified in our 8.4 GHz data seems to be misaligned with respect to the others, detected at a PA of 170 degrees. It might represent a curved structure undetected in the other observations.
In Table 8, we report the spectral index of TXS 1100+122 measured from VLBI data. The source shows an inverted spectrum with a peak around 8.4 GHz. In the 8.4–23.5 GHz frequency range, the spectrum is flat. A flatter spectrum at lower frequencies (between 2.3 GHz and 8.4 GHz) results from the archival RFC data (Table 10). Our spectral index measurements disagree with the spectral behaviour observed with the RATAN-600 telescope, as reported by Kovalev et al. (2020a). The synchrotron spectrum derived from the RATAN-600 observation is inverted up to 22 GHz. In fact, they measured the highest flux density, 552 ± 39 mJy, at 22 GHz. Around this frequency, we observed a flux density of ∼390 mJy. A RATAN-600 observation was performed on 11 and 14 January 2020, only a few days after the neutrino detection, while our follow-up was carried out more than one month after the detection. The different flux density measurements around 22 GHz and 23.5 GHz could suggest that the radio-flare from TXS 1100+122 occurred before or simultaneously to the neutrino emission and that we observed the source once the flare was already extinguished. As reported in the NRAO notice mentioned at the beginning of this section, because the BG263 observation was carried out in DDC mode, the flux density of TXS 1100+122 at 23.5 GHz could be 12% lower than the one that we measured. By adding a factor of 12% to Eq. (1) (squaring sum), we obtain a flux density of 392±61, so the upper limit would be 453 mJy. The 22 GHz RATAN-600 lower limit is 513 mJy, which results in a non-negligible difference of about 60 mJy between our and RATAN-600 estimation. Part of this discrepancy may arise from the difference in spatial scales to which RATAN-600 and VLBA are sensitive. Diffuse emission contributes to the total flux density measured by RATAN-600 while it is filtered out by VLBA. For this reason, the flux densities measured by the two instruments must always obey the following relation: SRATAN − 600 ≥ SVLBA. However, it is not possible to determine if the discrepancy of 60 mJy is entirely attributable to this effect or if it indicates an actual decrease of the flux density of the source in the time range between the RATAN-600 and VLBA observations.
RFC Spectral index.
We evaluated the variability of the source with respect to the RFC data taken at 8.6 GHz, which is the frequency closest to our observation frequency. We obtained V = 0.38 between 2012 and 2020 (Table 11). From NVSS and FIRST data, TXS 1100+122 flux densities at 1.4 GHz are consistent to each other and lower than our observations (Tables 6 and 7). Although the different resolution and observing frequency do not allow for a rigorous comparison between the NVSS and FIRST results and the VLBI measurements, a simple explanation for the discrepancy in the flux density is offered by the inverted spectrum in the low frequencies regime (see Table 8), which implies low flux density at that frequency. Adopting the spectral index measured from our data, the flux density extrapolated at 1.4 GHz results in agreement with the one inferred from the survey data. The presence of emission on intermediate angular scales seems unlikely. Carried out two years prior to the neutrino detection, the first epoch VLASS observation of TXS 1100+122 reveals flux density measurement in agreement with the NVSS and FIRST results. In the second VLASS epoch (a few months after the neutrino detection and after our observations) the source shows higher flux density compared to the first VLASS epoch. The two measurements are, however, consistent with each other within the uncertainties (V = −0.05). This suggests there is no significant variability on arcsecond scales, but we also remark that the VLASS data are still preliminary and should not be over-interpreted.
Variability index calculated between our VLBI observations and RFC observations.
IC 201021A. Two γ-ray sources have been detected as possible IC 201021A counterparts. We performed the e-MERLIN follow-up of this event and the resulting images parameters are reported in Table 7.
PKS 1725+123. This source lies about 70 arcmin outside the 90% localisation region of the event. However, being a bright FSRQ experiencing a temporal coincident high state at 15.3 GHz (from the MOJAVE data, described below), it would represent a good candidate for the neutrino association. Our e-MERLIN observation shows a jet structure pointing northwest (Fig. 4). The emission extends for about 700 mas from the core, which corresponds to a distance of ∼4.6 kpc (6.6 pc mas−1). The jet remains collimated along this distance. From the 5.1 GHz e-MERLIN observation, it results that the emission from the core region dominates over the total flux density of the source. The same emerges from survey observations that sample arcsecond scales (Table 6). In addition, our 5.1 GHz flux density and the survey’s 1.4 GHz and 3 GHz flux densities are comparable to each other within the errors, indicating the dominance of the core emission holds from the smaller scales over larger ones. The model-fit analysis of the e-MERLIN visibility data indicates that the jet contributes less than 5% to the total emission, while the largest contribution is given by the compact core component. Best-fit model parameters are reported in Table B.2.
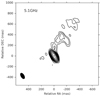 |
Fig. 4. e-MERLIN contour image of PKS 1725+123. The contour levels are drawn from 3× the rms noise of the images and increase by a factor of 2. The noise level and the beam size of the image are reported in Cols. 7 and 8 of Table 7. The black ellipse in the bottom left corner represents the restoring beam. |
With PKS 1725+123 being a bright VLBI calibrator, it has frequently been monitored with VLBI observations over the years. We reported the last five 15.3 GHz-MOJAVE observations taken in epochs close to the neutrino detection, with one precisely conducted on the day of the detection (Table 5). The model-fit analysis that we performed on the MOJAVE data (Table B.2) does not highlight long-standing features in the jet between 2018 and 2020.
The 15.3 GHz flux density is higher than our almost simultaneous 5.1 GHz observation due to the inverted shape of the self-absorbed synchrotron spectrum of the core. As a consequence of the different scales sampled by the e-MERLIN and VLBI data, we could not calculate the spectral index between 5.1 GHz and 15.3 GHz in a proper way, despite the data being taken almost simultaneously. The uv range of the two datasets does not overlap. To set an upper limit to the core spectral index using the available data, we first identified the core emission region in the e-MERLIN data. To do this, we fitted the visibility points with a delta function and an extended elliptical component representing the jet contribution. The jet component extends on angular scales, which are filtered out by the VLBI observations; then, the e-MERLIN delta function alone can be considered as the core emission region. The flux density of this component is 323 ± 16 mJy. We then interpolated the 15.3 GHz-MOJAVE data assuming a linear growth with time between the last MOJAVE epochs and retrieved the 15.3 GHz flux density value at the date of our e-MERLIN observation. This results to be 572 ± 57 mJy. Finally, the calculated 5.1 GHz to 15.3 GHz spectral index is 0.5 ± 0.1.
The variability index of the source at 15.3 GHz turns out to be ∼0.1 in the time range close to the neutrino event (25 May 2020 vs. 01 Dec 2020), showing that an increased activity is detected at least in the nuclear region.
1RXS J172314.4+142103. This is the possible counterpart for the newly detected γ-ray source, J1725.5+1312, reported in Buson et al. (2020b). This γ-ray source was significantly detected in the γ-ray band when only performing the integration of the Fermi data taken over a period of ten years (Buson et al. 2020b). This suggests the idea that J1725.5+1312 is a faint source in the γ-ray band, experiencing high and low levels of activity. Also, the association with a radio (although weak) counterpart identified in the VLASS data indicates that it represents a good blazar candidate.
1RXS J172314.4+142103 is clearly detected in our e-MERLIN images. Its radio structure consists of a main component with a flux density of about 0.96 mJy and a blob component 90 mas southeast of the core with a flux density of about 160 μJy. The source is not detected in the NVSS, allowing us to set an upper limit of about 0.6 mJy (i.e. 3 times the noise measured on the image plane). No FIRST data are available for 1RXS J172314.4+142103, as the source is slightly outside the region covered by the survey. In the VLASS image, 1RXS J172314.4+142103 appears as a compact source with a flux of 0.9±0.1 mJy (Table 6), consistently with our result. No indication about the 1RXS J172314.4+142103 variability can be deduced from the available data.
IC 201114A. The IC 201114A gold event was found in spatial coincidence with three possible counterparts, two of them are known blazars without an associated γ-ray source (Table 3). Here, we focused on the only candidate with a γ-ray association: NVSS J065844+063711, which has also been targeted by a multi-wavelength campaign started after the neutrino detection (de Menezes et al. 2021, de Menezes et al. in prep.). A low-significance excess of archival low-energy neutrinos observed by IceCube and spatially consistent with the source is reported in Hooper et al. (2019). Moreover, a 155 GeV photon from the γ-ray counterpart of NVSS J065844+063711 has been detected by the Fermi-LAT on 28 Jan 2018 (Buson et al. 2020a). The γ-ray source is also included in the Third Fermi-LAT Catalog of High-Energy Sources (3FHL; Ajello et al. 2017), suggesting it as a potential very-high-energy-emitting blazar. We present the analysis on the two other candidates in Appendix A.
In Fig. 5, we show the NVSS J065844+063711 images produced at 4.9 GHz, 8.4 GHz, and 23.5 GHz. The parameters of the images are reported in Table 7. The source slightly extends towards the west. With the VLBI data, we were able to partially resolve the jet structure. To represent the morphology of this emission by means of discrete Gaussian components, we performed the model-fit analysis with the DIFMAP routine. In the 4.9 GHz image, the best-fit representation of NVSS J065844+063711 is obtained with a point-like core component and two additional components for the jet. We also carried out the model-fit analysis in the RFC data, finding no evidence of standing-shocks as bright knots present at the different epochs. The model-fit, best-fit parameters are reported in Table B.3.
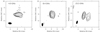 |
Fig. 5. EVN-4.9 GHz and VLBA-8.4 and −23.5 GHz contour images of NVSS J065844+063711. The contour levels are drawn starting from 3× the rms and are spaced by power of two. The noise level and the beam size of each image are reported in Cols. 7 and 8 of Table 7. The black ellipse in the bottom left corner represents the restoring beam. |
NVSS J065844+063711 is compact at arcsecond scales, as deduced from the consistency between the peak brightness (i.e. the core emission) and the total flux density in the NVSS and VLASS observations (Table 6). Moreover, the TeV Effelsberg Long-term AGN MONitoring (TELAMON) programme targeted NVSS J065844+063711 after the IC 201114A event. By comparing our results to the TELAMON ones (Kadler et al. 2021), the VLBI total flux density of NVSS J065844+063711 at 4.9 GHz seems to be consistent with the flux density recorded around the same frequency by the Effelsberg single dish, suggesting that the extended emission from this source is negligible and confirming its compact nature.
Table 8 reports the spectral indices of the core measured with the VLBI data. The spectrum is self-absorbed between lower frequencies and flat between high frequencies. The same behaviour was observed from the archival RFC data (Table 10).
Both NVSS and 2017-VLASS data of NVSS J065844+063711 show a higher flux density compared to our VLBI results. Slightly lower flux density values with respect to the first VLASS epoch are also derived in the second VLASS epoch, taken four months before the neutrino event and three years after the first epoch. Therefore, archival data also seem to suggest that in the time range just before and soon after the neutrino detection, NVSS J065844+063711 was experiencing a low activity state in the radio band (Fig. 6). The decrease of the radio flux density on mas scales was up to V ≃ 0.17 at around 4.3 GHz between 2013 and 2020 (Table 11). On the other hand, the TELAMON monitoring of NVSS J065844+063711 (Kadler et al. 2021) suggests the presence of variability on potentially much smaller timescales.
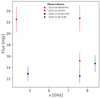 |
Fig. 6. NVSS J065844+063711 total radio flux density at different frequencies and epochs. |
5. Discussion
We conducted VLBI follow-ups of cosmic neutrino events in order to analyse the status of the radio emission of the blazar sources spatially consistent with these events. We present a total of five sources potentially associated with four IceCube events. We identified one favoured candidate (on the basis of its blazar-like nature and its association with a γ-ray source) for each event. Only in the case of IC 201021A we investigated two sources; one of them is the only out-of-90%-neutrino-error-region object studied in detail in this work. It was included in the analysis on the basis of its potentially interesting variability and multi-wavelength characteristics (see Sect. 4). In our search for possible blazar neutrino emitters, we found a heterogeneous sample of objects. In this section, we discuss our results on the properties of these candidate counterparts in comparison with the current knowledge about the neutrino-blazar connection.
The typical radio properties of the blazars, such as the core-dominated jet structures and the inverted and flat spectra, drove our candidate selection among the radio sources spatially coincident with the neutrino events that we observed. These properties are confirmed with our VLBI data. Also in the γ-ray regime, we found expected values of γ-ray photon index (Table 2); harder γ-ray photon indices are observed in HSP-like sources, while softer ones are found for FSRQ sources.
5.1. Jet morphology and kinematics
Theoretical arguments indicate that compact parsec-scale regions of blazars are sites of efficient neutrino production. Focused analyses on TXS 0506+056 suggest a connection between this blazar and the neutrino emission. In particular, the increase of the core size of TXS 0506+056 and of the opening angle of its jet was clearly identified after the neutrino detection. These were addressed as observational key features indicating the neutrino production (Ros et al. 2020). Moreover, from the evolution of the PA, Li et al. (2020) inferred a helical structure in the TXS 0506+056 jet. They pointed out the link between this configuration and the occurrence of instabilities at the base of the jet. These mechanisms, in turn, likely drive efficient particle acceleration and the neutrino production in these sites.
All five candidates presented in this work are found to be compact and core dominated from mas to arcsecond scales. We were able to resolve a faint one-sided jet for three of the candidates: the two FSRQ sources, TXS 1100+122 (associated with IC 200109A) and PKS 1725+123 (associated with IC 201021A), and the blazar candidate NVSS J065844+063711 (associated with IC 201114A). In the e-MERLIN image of the faintest source of our sample, 1RXS J172314.4+142103 (associated with IC 201021A), we observed only a small blob southeast of the core, while in the HBL object, 1WHSP J104516.2+275133 (associated with IC 190704A), no jet structure was detected in our observations. Performing the model-fit analysis on the jetted sources for which we have multi-frequency observations, TXS 1100+122 and NVSS J065844+063711, we did not reveal distinct bright knots present in their jets at different frequencies. Also, we did not identify components that can be clearly recognised in the archival RFC data at the same frequencies in our data. From the analysis of two epochs of 2016-MOJAVE data, Lister et al. (2019) highlighted the presence of a discrete component in the jet of PKS 1725+123. They measured an apparent speed of this component of (12 ± 8) μas yr−1; that is, (0.40 ± 0.28)c. A similar value was found by Li et al. (2020) for the closest-to-the-core component of the TXS 0506+056 jet. Testing the kinematics and the evolution of this component with future high resolution VLBI data could become relevant in order to compare the PKS 1725+123 and TXS 0506+056 cases and infer a possible relation with the neutrino production.
The trend of the PA of the TXS 1100+122, PKS 1725+123 and NVSS J065844+063711 jets seems to remain unchanged over the period between the observations (see Table B.1 for TXS 1100+122, Table B.2 for PKS 1725+123 and Table B.3 for NVSS J065844+063711). The analysis of the PA variation with time performed by Li et al. (2020) is not fully compatible with the cases studied here, because we could not identify the comparable jet components in each epoch and because the data are poorly sampled in time.
As far as the relation between neutrino production and blazar core size is concerned, in the case of TXS 0506+056, the source increased its core size from 68 μas to 158 μas in the six months after the neutrino detection (Ros et al. 2020). The apparent expansion occurred at about twice the speed of light at the redshift of TXS 0506+056 (z = 0.34, Paiano et al. 2018). As suggested by Ros et al. (2020), this behaviour should test the presence of ongoing hadronic processes of which high-energy neutrinos are very likely products. In the case of TXS 1100+122, the 8.4 GHz core is smaller in our observations than in the 2007 and 2012 RFC observations at the same frequency (see Table B.1). However, the core linear size is much larger in TXS 1100+122 (about 1.2 pc) than in TXS 0506+056, both before (∼0.33 pc) and after (∼0.76 pc) the apparent superluminal expansion; this is due to TXS 1100+122 being located at redshift 0.91, while TXS 0506+056 is at redshfit 0.34. Based on the RFC and our data, we can speculate that TXS 1100+122 is in its initial compact phase, which could be followed by an expansion phase in the future.
In the case of PKS 1725+123 throughout the 2020 MOJAVE observations (15.3 GHz), the core size did not change significantly within the uncertainties (see Table B.2). Also in this case, however, the source is more distant than TXS 0506+056 and therefore our angular resolution does not allow us to probe the scales of the expansion discussed by Ros et al. (2020). An important caveat in this context is that Ros et al. (2020) deduced the superluminal expansion of the core from 43 GHz VLBA observations. Due to the small beam size, mm-VLBA observations are a desirable approach for future core size expansion measurements.
We derived the observed core brightness temperatures,  , using Eq. (2) from Condon et al. (1982). For TXS 1100+122, we found
  K in the 2007 RFC data,
  in the 2012 RFC data, and
  K in our 2020 data, all at 8.4 GHz. The brightness temperature depends not only on the core geometric factors but also on its flux density. Differences in brightness temperature values reflect different physical conditions in the core. The observed variation might be a result of a larger Doppler boosting factor in the 2020 data compared to the past data (e.g., Kardashev 2000; Kellermann 2002). In general, such values of
  suggest the presence of a highly relativistic flow. The core brightness temperature of PKS 1725+123 at 15.3 GHz is
  K based on the May 2020 data,
  K in the October 2020 data, and
  K in the December 2020 data. At 15.3 GHz, Li et al. (2020) observed values of TB in TXS 0506+056 core that are significantly higher in the observing epochs following the IC 170922A event with respect to the previous observations. However, it must be noted that a rigorous comparison between the model-fit results from our and RFC data is not actually possible because of the difference between the (uv) sampling of our and RFC data. For this reason, the core components of both TXS 1100+122 and PKS 1725+123 are not unambiguously and uniformly identified in each epoch.
Limb-brightening and transverse structure features are invoked for explaining the high-energy neutrino emission when an external (to the jet) seed photon field is lacking. This is the case of BLL objects for which a two-layer spine-sheath jet have been proposed (Tavecchio et al. 2014). The two layers of the jet, moving with different Doppler factors (highly relativistic spine and slower external sheath) are thought to provide an energetic enough photon field owing to their relative motion. In this context, limb-brightening and transverse structure are then expected to be observed in possible neutrino counterparts and, indeed, these have been found by Ros et al. (2020) in TXS 0506+056. Interestingly, PKS B1424-418 jet (proposed as counterpart of HESE-35; Kadler et al. 2016) also exhibits hints of transverse structures in its tapered image (Ojha et al. 2010). Based on a simple, by-eye inspection of the flux density contour levels of the images, limb-brightening configuration is not visible in any of the jetted sources. In the case of NVSS J065844+063711, if the spine-sheath layer structure is present, the low flux density of the source combined to the observing limitations could have prevented the detection of such features.
5.2. Flux density variability
A temporal connection between an increased flux density around 22 GHz and the neutrino arrival is deduced in VLBI observations by Plavin et al. (2020) and confirmed with single-dish observations at 15 GHz by Hovatta et al. (2021) for a sample of blazars. Single-source works also support this idea (e.g., Kadler et al. 2016; Ros et al. 2020). According to Plavin et al. (2020), the simultaneity between the neutrino event and the radio flare could be due to an energetic radio outflow arising from particle injection mechanisms occurring near the central black hole. Based on the energetic requirements and the synchrotron opacity constraints, Plavin et al. (2020, 2021) were also able to confine the region of the neutrinos’ origin in the core of blazars to within a few parsecs at the jet base. The increased radio activity in TXS 0506+056 can be noted in the light curves reported by IceCube Collaboration (2018), and it results in a significant (according to Aller et al. 1992) variability of V ∼ 0.1 from the VLBI data referring to the time range between Nov 2017 and May 2018 (these values of flux density are taken from Ros et al. 2020). We highlight that the variability index defined in Eq. (2) is mostly useful to compare the flux density variations in objects which show large differences in flux density levels. In this way, the V-index allows us to quantitatively verify if the emission of a source has significantly varied. However, it could not be sufficient to catch the magnitude of radio flares, as can be seen in the low value of V measured even for the case of TXS 0506+056. The same consideration holds with other variability indicators. Hovatta et al. (2021) applied an activity index to the OVRO light curve data of a sample of blazars to detect the presence of high states. They also claim that their approach could fail to properly reflect notable flaring states of the sources. Plavin et al. (2020) pointed out that the self-absorption in the more compact (and then variable) central regions, together with the contribution of the unresolved diffuse emission, could lead to the underestimating of the variability in the radio activity of the sources.
In our sample, one of the five sources, PKS 1725+123, shows a high state of activity in the radio band. We revealed an increased activity (V ∼ 0.1) from the 15.3 GHz MOJAVE data of this source. The neutrino was detected on 21 Jan 2020 while the 15.3 GHz flux density started to grow from May 2020 (Table 5).
The preliminary results from the RATAN-600 observations, reported by Kovalev et al. (2020a), suggest an increase of the TXS 1100+122 emission soon after the neutrino detection and before our observations (carried out one month after the neutrino arrival). At the same RATAN-600 frequency, we observed a lower value of flux density. As discussed in Sect. 4, the discrepancy between our and the RATAN-600 flux density also holds if we account for the VLBA calibration issues described in the NRAO notice. The discrepancy can be due to either the different sensitivity of RATAN-600 and VLBA to the diffuse emission, or to the variability of the source itself.
An extraordinarily low activity level of TXS 1100+122 was observed in the 2012 RFC data (Table 5). If we compare our flux density measurement to this observation, we could speculate, in line with RATAN-600 results, that the source is also, in fact, in a significantly higher state in our observation (Table 11). However, with this RFC flux density measurement being from a single isolated epoch, separated by several years from our observation, the indication of an increased flux density does not lead to firm conclusions. In our VLBI data, TXS 1100+122 was in a state of activity compatible with the 2004 and 2007 RFC observations.
While 1WHSP J104516.2+275133 does not seem to exhibit an enhanced flux density and no VLBI archival data of 1RXS J172314.4+142103 are available to check its variability, the last of the five sources, NVSS J065844+063711, is clearly in a low state of activity in the radio band at the neutrino arrival, as deduced by the comparison of our results with the archival RFC observations (Table 11). The largest change in the flux density follows by comparing the 2013 RFC data with our EVN observation, both carried out at ∼4.3 GHz. As noted above and reported in several works, the low frequencies are less affected by the activity occurring within the jet base and core (i.e. the region in which the neutrino production is thought to happen). Since we lack archival data of NVSS J065844+063711 at high frequencies, we could not determine the state of activity at these frequencies. However, the lack of an enhanced state of activity is not in contrast to what was found in the case of TXS 0506+056. Indeed, after the IC 170922A event, the inspection of archival IceCube and multi-wavelength data from the direction of TXS 0506+056 resulted in evidence of a neutrino flux excess from that position. In coincidence with this archival neutrino detection, no radio flares have been detected along with other-wavelength flares.
5.3. High-energy neutrino production
The origin of neutrinos in blazars can be associated with regions enabling the acceleration of relativistic protons and cosmic rays (e.g., Matthews et al. 2020). These sites can be hosted by the accretion disc and relativistic jet, which offer a favourable environment for hadronic and photo-hadronic interactions that produce neutrinos (e.g., Mannheim 1995; Matthews et al. 2020; Righi et al. 2019; Murase et al. 2020). The shock acceleration of protons in a turbulent environment must occur over timescales shorter than those involving synchrotron energy loss or the diffusion of protons away from the acceleration zone (e.g., Zhang et al. 2017).
The shock itself may originate from a diversity of physical processes in the central nuclear region. Jet scenarios include propagating or re-confinement shocks at varying distances from the supermassive black hole (e.g., Ghisellini et al. 2002; Matthews et al. 2020; Zech & Lemoine 2021), magnetic re-connections (e.g., Shukla & Mannheim 2020; Matthews et al. 2020), interaction with transiting gravitationally bound clouds or clumps (e.g., Araudo et al. 2010), or an interaction with the external radiation field (e.g., Hoerbe et al. 2020; Winter & Lunardini 2021).
The physical characteristics of the production region can be probed by comparing the acceleration timescale for protons tacc with the dynamical timescale over which any changes are propagated, tdyn. Assuming a second-order Fermi acceleration of the protons (e.g., Kimura et al. 2015; Hayasaki & Yamazaki 2019),
 (3)
(3)
where r is the radial distance to the acceleration location, vA = B/(4πρ)1/2 is the Alfvén velocity expressed in terms of the magnetic field strength B and local density ρ, rL ∼ mpc2/(eB) and γ are the Larmor radius and the Lorentz factor of the protons, and s = 1.5−2 is the spectral index of the turbulence scale length distribution.
For the jet scenario, the dynamical timescale tdyn is the typical time for the propagation of a signal in a region of size ϖ = r/Γ projected along the observer line of sight (assuming a jet bulk Lorentz factor Γ) and is
 (4)
(4)
where vj/c = (1 − Γ−2)1/2 is the jet bulk velocity scaled in units of c, RS = 2GM•/c2 is the Schwarzschild radius around a black hole of mass M•, and  is a scaled radial distance. The density of plasma in the jet can be evaluated using
 (5)
(5)
where Lj,kin is the kinetic energy in the jet. Assuming that the energy equipartition holds in the jet, the magnetic field strength is
 (6)
(6)
where β is the plasma beta (ratio between the plasma pressure and the magnetic field pressure). With the condition tacc ≤ tdyn, assuming β = 1, s = 1.5, vj/c ≈ 1,
 (7)
(7)
The above rough estimates indicate that protons can certainly be accelerated to PeV or greater energies. Individual neutrinos up to PeV energies can be produced with the availability of suitable cross sections for the hadronic and photo-hadronic interactions as they are expected to have energies of Eν ≈ Ep/20 (e.g., Hayasaki & Yamazaki 2019). This toy model then offers strong support of jets as hosts of energetic protons and neutrinos. Distinguishing between this and other scenarios, such as the one involving mechanisms occurring at the accretion disc site, is beyond the scope of the current work.
5.4. Searching for neutrino-emitting sources
Other neutrino-emitter candidates are currently taken into account. One of the most intriguing phenomena is the case of the tidal disruption event (TDE) AT2019dsg, which is highly likely to be associated with with the IC 191001A detection (Stein & Velzen 2021). TDEs take place when a star orbits too close to the central supermassive black hole in a galaxy and it is destroyed under the action of the tidal force (see e.g., Komossa 2013, for a review). The star destruction releases energetic outflows able to produce high-energy cosmic particles and high-energy neutrinos. Other studies mostly focus on the connection between the X-ray emission from blazar and the neutrino events (e.g., Stathopoulos et al. 2021), while others investigate specific classes of AGN (e.g., Maggi et al. 2017) or all radio-loud AGN (Larson et al. 2021). According to Giommi et al. (2020a), IBL and HBLs are promising counterparts of neutrinos.
The growing number of astrophysical objects showing hints of a connection with neutrino emission suggests we should keep the door open to all kinds of possible neutrino event-related sources. In this context, we also observed non-blazar-like sources (reported in Appendix A) and sources slightly out of the neutrino error region to leave an observational reference for further studies on the astrophysical neutrino counterparts. The sources analysed in this work have not previously been studied in detail, and for some of them we also provide VLBI observations for the first time. We stress the fact that our VLBI observations are crucial, not only for the improved quality of the data with respect to the archival VLBI data of the targets but, above all, for their temporal coincidence with the (still not easily detectable) neutrino arrivals. Then, these data provide a unique opportunity to investigate the evolution of the possible electromagnetic counterparts after the neutrino detection.
In particular, dense monitoring of the sources is required to efficiently estimate proper motions of the components of the jet (e.g., Blasi et al. 2013). Proper motion studies will allow us to infer the physical and geometrical parameters of the jets. As shown in the previous section, some of these parameters, such as, for example, the magnetic field strength or the jet bulk Lorentz factor, could provide a test for the theoretical expectations.
Due to the limited sensitivity of IceCube at high energies, the collected detections are considered to be the tip of the iceberg of larger low-energy neutrino flux. In this regard, retrieving the IceCube archival data of the neutrinos observed at lower energies could be worthwhile in order to confirm the presence of low-energy neutrino excess from the positions of the sources analysed here. The IceCube Realtime Streams do not provide all the high-energy events.
So far, no source has been found coincident with a significant excess of neutrinos, except for the known cases of evidence found for TXS 0506+056 and NGC 1068 (Aartsen et al. 2020). These kinds of searches are often penalised by a large number of trial factors, and it would be important to have a limited number of source positions tested based on their potential association with neutrino events. Therefore, we suggest performing a dedicated analysis of neutrino data testing detections at the position of our candidates PKS 1725+123, TXS 1100+122 and NVSS J065844+063711 for which the connection with the neutrino production is supported by some observational indications in our paper. In an optimistic scenario, this could lead to findings similar to the 2014–2015 neutrino excess from the direction of TXS 0506+056.
6. Summary and conclusions
We presented VLBI follow-up observing results of four IceCube neutrino events, both with high and moderate (gold and bronze) probabilities of being associated with a cosmic origin. We analysed data of a total of ten radio sources in spatial coincidence with the neutrino events. Following previous results reported for the case of TXS 0506+056, and the ones based on statistical approaches using VLBI data, we aimed to identify the possible neutrino emitters by testing the presence of radio properties connected to the neutrino production processes. We used our follow-up data in comparison to VLA (NVSS, FIRST, VLASS) surveys and archival VLBI (RFC) data. The candidate neutrino counterparts have a heterogeneous optical classification, ranging from BLL to FSRQ and including a few sources of uncertain classification. Among the ten candidates, we selected five blazar-like sources (on the base of their radio properties) with a γ-ray counterpart. A description of the other candidate counterparts is provided in Appendix A. The main outcomes on the five principal candidates can be summarised as follows:
-
The core spectral behaviour of all the sources is well represented by a self-absorbed spectrum at low radio frequencies and a flat spectrum at high radio frequencies. When the objects are bright and the image noise allows it, we are able to recognise a core-jet morphology. These appear in three of the sources. All sources are compact from mas VLBI resolutions to arcsecond VLA survey resolutions.
-
From a morphological point of view, we did not identify parsec-scale radio properties in our sample that could be linked to the neutrino emission, as was previously studied in the case of TXS 0506+056 and expected from theoretical arguments. This can be mostly due to the lower quality of archival data compared to our new data and the lack of frequent observations of these sources in the past at VLBI resolution.
-
One of the five candidates, FSRQ PKS 1725+123 exhibits hints of an enhanced activity state in our data. However, it is found outside the 90% localisation region around the neutrino position. Another source, NVSS J065844+063711, is found in a low radio activity state. The case of TXS 1100+122 remains ambiguous since in only one archival RFC observation does this source show a lower flux density with respect to our results, while previous RFC flux density measurements are in agreement with our results. On the other hand, Kovalev et al. (2020a) confirmed a high state of TXS 1100+122 at the neutrino arrival.
-
None of the sources show exceptionally outstanding properties, in terms of their radio luminosity, variability, and kinematics. However, while we are well able to derive the radio luminosity values from our observations, the variability and the kinematics parameters are much less constrained.
-
We present a toy model for proton acceleration in jets that supports the jet scenario for neutrino production in these sites. The model requires kinetic parameters that can be inferred by well-time-sampled VLBI jet monitoring. As mentioned above, a study of the kinetic parameters of the jet motion will require a longer dedicated VLBI monitoring campaign that we are undertaking as a development of this project.
In conclusion, based on the analysis of the morphological evolution, we cannot exclude or support the hypothesis of the sources analysed as a potential neutrino counterpart. However, the results, which suggest significant variability in the radio band in PKS 1725+123 at the neutrino arrival are consistent with the evidence of radio flares in blazars in temporal coincidence with neutrino emission (Plavin et al. 2020; Hovatta et al. 2021).
Very-long-baseline interferometric results provide us with important pieces of information on the neutrino candidates. In addition, a complete characterisation of these candidate neutrino-associated sources could hopefully come from the combined efforts of multi-wavelength campaigns, triggered almost simultaneously to our follow-up (e.g., de Menezes et al. 2021, de Menezes et al. in prep), together with the planned VLBI observations that we will present in future works. Further investigation into these candidates and, most importantly, the identification of a large number of new ones, will shed light on the open question of the nature of extragalactic neutrinos and of blazars as the best candidate neutrino counterparts.
Despite the name, the GCN archive collects alerts on all kinds of transients (not only on GRB). The archive can be consulted at https://gcn.gsfc.nasa.gov/gcn/gcn3_archive.html
In some cases, a so-called check-source is added to the VLBA observation schedule in order to test on this the goodness of the phase solutions derived from the phase calibration, see https://science.nrao.edu/facilities/vlba/docs/manuals/obsvlba/referencemanual-all-pages
The VLASS images are taken from the Canadian Initiative for Radio Astronomy Data Analysis (CIRADA) catalog (https://cirada.ca/catalogues; Gordon et al. 2020).
Acknowledgments
We thank the referee for her/his useful suggestions. J.M. and MPT acknowledge financial support from the State Agency for Research of the Spanish MCIU through the “Center of Excellence Severo Ochoa” award to the Instituto de Astrofísica de Andalucía (SEV-2017-0709) and through grants RTI2018-096228-B-C31 and PID2020-117404GB-C21 (MICIU/FEDER, EU). S.B. acknowledges financial support by the European Research Council for the ERC Starting grant MessMapp, under contract no. 949555. B.W.S. is grateful for the support by the National Research Foundation of Korea (NRF) funded by the Ministry of Science and ICT (MSIT) of Korea (NRF-2020K1A3A1A78114060). We thank to L. Petrov for granting permission for using data from the Astrogeo VLBI FITS image database. The European VLBI Network is a joint facility of independent European, African, Asian, and North American radio astronomy institutes. Scientific results from data presented in this publication are derived from the following EVN project codes: RG011, EG108. The National Radio Astronomy Observatory is a facility of the National Science Foundation operated under cooperative agreement by Associated Universities, Inc. This work made use of the Swinburne University of Technology software correlator, developed as part of the Australian Major National Research Facilities Programme and operated under licence. e-MERLIN is a National Facility operated by the University of Manchester at Jodrell Bank Observatory on behalf of STFC. This research has made use of data from the MOJAVE database that is maintained by the MOJAVE team (Lister et al. 2018). This research has made use of the CIRADA cutout service at URL cutouts.cirada.ca, operated by the Canadian Initiative for Radio Astronomy Data Analysis (CIRADA). CIRADA is funded by a grant from the Canada Foundation for Innovation 2017 Innovation Fund (Project 35999), as well as by the Provinces of Ontario, British Columbia, Alberta, Manitoba and Quebec, in collaboration with the National Research Council of Canada, the US National Radio Astronomy Observatory and Australia’s Commonwealth Scientific and Industrial Research Organisation. This research has made use of the NASA/IPAC Extragalactic Database (NED), which is operated by the Jet Propulsion Laboratory, California Institute of Technology, under contract with the National Aeronautics and Space Administration.
References
- Aartsen, M. G., Abbasi, R., Abdou, Y., et al. 2013, Phys. Rev. Lett., 111, 021103 [Google Scholar]
- Aartsen, M. G., Ackermann, M., Adams, J., et al. 2014, Phys. Rev. Lett., 113, 101101 [Google Scholar]
- Aartsen, M. G., Abraham, K., Ackermann, M., et al. 2017, ApJ, 835, 45 [Google Scholar]
- Aartsen, M. G., Ackermann, M., Adams, J., et al. 2020, Phys. Rev. Lett., 124, 051103 [Google Scholar]
- Abdo, A. A., Ackermann, M., Agudo, I., et al. 2010, ApJ, 716, 30 [NASA ADS] [CrossRef] [Google Scholar]
- Abdollahi, S., Acero, F., Ackermann, M., et al. 2020, ApJS, 247, 33 [Google Scholar]
- Ackermann, M., Ajello, M., Atwood, W. B., et al. 2015, ApJ, 810, 14 [NASA ADS] [CrossRef] [Google Scholar]
- Ajello, M., Atwood, W. B., Baldini, L., et al. 2017, ApJS, 232, 18 [Google Scholar]
- Alam, S., Albareti, F. D., Allende Prieto, C., et al. 2015, ApJS, 219, 12 [Google Scholar]
- Aller, M. F., Aller, H. D., & Hughes, P. A. 1992, ApJ, 399, 16 [NASA ADS] [CrossRef] [Google Scholar]
- Araudo, A. T., Bosch-Ramon, V., & Romero, G. E. 2010, A&A, 522, A97 [NASA ADS] [CrossRef] [EDP Sciences] [Google Scholar]
- Arsioli, B., Fraga, B., Giommi, P., Padovani, P., & Marrese, P. M. 2015, A&A, 579, A34 [NASA ADS] [CrossRef] [EDP Sciences] [Google Scholar]
- Becker, R. H., White, R. L., & Helfand, D. J. 1994, in Astronomical Data Analysis Software and Systems III, eds. D. R. Crabtree, R. J. Hanisch, & J. Barnes, ASP Conf. Ser., 61, 165 [NASA ADS] [Google Scholar]
- Blasi, M. G., Lico, R., Giroletti, M., et al. 2013, A&A, 559, A75 [EDP Sciences] [Google Scholar]
- Böttcher, M. 2019, Galaxies, 7, 20 [Google Scholar]
- Buson, S., Garrappa, S., Cheung, C. C., & Ajell, M. 2020a, ATel, 14111, 1 [NASA ADS] [Google Scholar]
- Buson, S., Garrappa, S., & Cheung, C. C. 2020b, ATel, 14200, 1 [NASA ADS] [Google Scholar]
- Chang, Y. L., Arsioli, B., Giommi, P., & Padovani, P. 2017, A&A, 598, A17 [NASA ADS] [CrossRef] [EDP Sciences] [Google Scholar]
- Chang, Y. L., Brandt, C. H., & Giommi, P. 2020, Astron. Comput., 30, 100350 [NASA ADS] [CrossRef] [Google Scholar]
- Condon, J. J., Condon, M. A., Gisler, G., & Puschell, J. J. 1982, ApJ, 252, 102 [Google Scholar]
- Condon, J. J., Cotton, W. D., Greisen, E. W., et al. 1998, AJ, 115, 1693 [Google Scholar]
- de Menezes, R., Buson, S., Garrappa, S., et al. 2021, in Proceedings of 37th International Cosmic Ray Conference– PoS(ICRC2021), 395, 955 [CrossRef] [Google Scholar]
- Franckowiak, A., Garrappa, S., Paliya, V., et al. 2020, ApJ, 893, 162 [Google Scholar]
- Garrappa, S., Buson, S., Franckowiak, A., et al. 2019a, ApJ, 880, 103 [NASA ADS] [CrossRef] [Google Scholar]
- Garrappa, S., Buson, S., & Venters, T. 2019b, ATel, 12906, 1 [NASA ADS] [Google Scholar]
- Garrappa, S., Buson, S., Paliya, V., & Fermi-LAT Collaboration 2020, ATel, 13402, 1 [NASA ADS] [Google Scholar]
- Ghisellini, G., Celotti, A., & Costamante, L. 2002, A&A, 386, 833 [NASA ADS] [CrossRef] [EDP Sciences] [Google Scholar]
- Giommi, P., Polenta, G., Lähteenmäki, A., et al. 2012, A&A, 541, A160 [NASA ADS] [CrossRef] [EDP Sciences] [Google Scholar]
- Giommi, P., Padovani, P., & Glauch, T. 2020a, ATel, 14225, 1 [NASA ADS] [Google Scholar]
- Giommi, P., Glauch, T., Padovani, P., et al. 2020b, MNRAS, 497, 865 [Google Scholar]
- Gordon, Y. A., Boyce, M. M., O’Dea, C. P., et al. 2020, Res. Notes Am. Astron. Soc., 4, 175 [Google Scholar]
- Greisen, E. W. 2003, in Information Handling in Astronomy - Historical Vistas, ed. A. Heck, Astrophys. Space Sci. Lib., 285, 109 [NASA ADS] [CrossRef] [Google Scholar]
- Hayasaki, K., & Yamazaki, R. 2019, ApJ, 886, 114 [NASA ADS] [CrossRef] [Google Scholar]
- Hoerbe, M. R., Morris, P. J., Cotter, G., & Becker Tjus, J. 2020, MNRAS, 496, 2885 [NASA ADS] [CrossRef] [Google Scholar]
- Högbom, J. A. 1974, A&AS, 15, 417 [Google Scholar]
- Hooper, D., Linden, T., & Vieregg, A. 2019, JCAP, 2019, 012 [CrossRef] [Google Scholar]
- Hovatta, T., Lindfors, E., Kiehlmann, S., et al. 2021, A&A, 650, A83 [NASA ADS] [CrossRef] [EDP Sciences] [Google Scholar]
- IceCube Collaboration 2013, Science, 342, 1242856 [Google Scholar]
- IceCube Collaboration (Aartsen, M. G., et al.) 2018, Science, 361, eaat1378 [NASA ADS] [Google Scholar]
- Kadler, M., Bach, U., Berge, D., et al. 2021, in Proceedings of 37th International Cosmic Ray Conference– PoS(ICRC2021), 395, 974 [CrossRef] [Google Scholar]
- Kadler, M., Krauß, F., Mannheim, K., et al. 2016, Nat. Phys., 12, 807 [Google Scholar]
- Kardashev, N. S. 2000, Astron. Rep., 44, 719 [NASA ADS] [CrossRef] [Google Scholar]
- Kellermann, K. I. 2002, PASA, 19, 77 [Google Scholar]
- Kimura, S. S., Murase, K., & Toma, K. 2015, ApJ, 806, 159 [Google Scholar]
- Komossa, S. 2013, in Feeding Compact Objects: Accretion on All Scales, eds. C. M. Zhang, T. Belloni, M. Méndez, & S. N. Zhang, 290, 53 [NASA ADS] [Google Scholar]
- Kovalev, Y. Y., Troitsky, S. V., Kovalev, Y. A., & Plavin, A. V. 2020a, ATel, 13397, 1 [NASA ADS] [Google Scholar]
- Kovalev, Y. A., Sotnikova, Y. V., Erkenov, A. K., et al. 2020b, 13405, 1 [Google Scholar]
- Kun, E., Biermann, P. L., & Gergely, L. Á. 2019, MNRAS, 483, L42 [NASA ADS] [CrossRef] [Google Scholar]
- Kun, E., Bartos, I., Tjus, J. B., et al. 2021, ApJ, 911, L18 [Google Scholar]
- Lacy, M., Baum, S. A., Chandler, C. J., et al. 2020, PASP, 132 [Google Scholar]
- Larson, M. J., Abbasi, R., Ackermann, M., et al. 2021, in Proceedings of 37th International Cosmic Ray Conference– PoS(ICRC2021), 395, 949 [Google Scholar]
- Li, X., An, T., Mohan, P., & Giroletti, M. 2020, ApJ, 896, 63 [NASA ADS] [CrossRef] [Google Scholar]
- Lister, M. L., Aller, M. F., Aller, H. D., et al. 2018, ApJS, 234, 12 [CrossRef] [Google Scholar]
- Lister, M. L., Homan, D. C., Hovatta, T., et al. 2019, ApJ, 874, 43 [NASA ADS] [CrossRef] [Google Scholar]
- Maggi, G., IceCube Collaboration, de Vries, K. D., & van Eijndhoven, N. 2017, in 35th International Cosmic Ray Conference (ICRC2017), 301, 1000 [NASA ADS] [Google Scholar]
- Mannheim, K. 1995, Astropart. Phys., 3, 295 [NASA ADS] [CrossRef] [Google Scholar]
- Matthews, J. H., Bell, A. R., & Blundell, K. M. 2020, New A Rev., 89 [Google Scholar]
- McMullin, J. P., Waters, B., Schiebel, D., Young, W., & Golap, K. 2007, in Astronomical Data Analysis Software and Systems XVI, eds. R. A. Shaw, F. Hill, & D. J. Bell, ASP Conf. Ser., 376, 127 [Google Scholar]
- Moldon, J. 2021, eMCP: e-MERLIN CASA pipeline [Google Scholar]
- Murase, K., Kimura, S. S., Zhang, B. T., Oikonomou, F., & Petropoulou, M. 2020, ApJ, 902, 108 [NASA ADS] [CrossRef] [Google Scholar]
- Ojha, R., Kadler, M., Böck, M., et al. 2010, A&A, 519, A45 [NASA ADS] [CrossRef] [EDP Sciences] [Google Scholar]
- Orienti, M., Koyama, S., D’Ammando, F., et al. 2013, MNRAS, 428, 2418 [Google Scholar]
- Padovani, P., Giommi, P., Falomo, R., et al. 2022, MNRAS, 510, 2671 [NASA ADS] [CrossRef] [Google Scholar]
- Paiano, S., Falomo, R., Treves, A., & Scarpa, R. 2018, ApJL, 854, L32 [CrossRef] [Google Scholar]
- Plavin, A., Kovalev, Y. Y., Kovalev, Y. A., & Troitsky, S. 2020, ApJ, 894, 101 [Google Scholar]
- Plavin, A. V., Kovalev, Y. Y., Kovalev, Y. A., & Troitsky, S. V. 2021, ApJ, 908, 157 [Google Scholar]
- Righi, C., Tavecchio, F., & Inoue, S. 2019, MNRAS, 483, L127 [NASA ADS] [CrossRef] [Google Scholar]
- Rodrigues, X., Garrappa, S., Gao, S., et al. 2021, ApJ, 912, 54 [NASA ADS] [CrossRef] [Google Scholar]
- Ros, E., Kadler, M., Perucho, M., et al. 2020, A&A, 633, L1 [NASA ADS] [CrossRef] [EDP Sciences] [Google Scholar]
- Shepherd, M. C., Pearson, T. J., & Taylor, G. B. 1994, BAAS, 26, 987 [NASA ADS] [Google Scholar]
- Shukla, A., & Mannheim, K. 2020, Nat. Commun., 11, 4176 [NASA ADS] [CrossRef] [Google Scholar]
- Stathopoulos, S. I., Petropoulou, M., Giommi, P., et al. 2021, in Proceedings of 37th International Cosmic Ray Conference – PoS(ICRC2021), 395, 1008 [CrossRef] [Google Scholar]
- Stein, R., van Velzen, S., Kowalski, M., et al. 2021, Nat. Astron., 5, 510 [NASA ADS] [CrossRef] [Google Scholar]
- Tavecchio, F., Ghisellini, G., & Guetta, D. 2014, ApJ, 793, L18 [NASA ADS] [CrossRef] [Google Scholar]
- Urry, C. M., & Padovani, P. 1995, PASP, 107, 803 [NASA ADS] [CrossRef] [Google Scholar]
- Winter, W., & Lunardini, C. 2021, Nat. Astron., 5, 472 [NASA ADS] [CrossRef] [Google Scholar]
- Zech, A., & Lemoine, M. 2021, A&A, 654, A96 [NASA ADS] [CrossRef] [EDP Sciences] [Google Scholar]
- Zhang, B. T., Murase, K., Oikonomou, F., & Li, Z. 2017, Phys. Rev. D, 96, 063007 [NASA ADS] [CrossRef] [Google Scholar]
Appendix A: Other candidates
NVSS J104938+274212 Lying within the 50% uncertainty region, 4FGL J1049.8+2741 was the first identified candidate source associated with the IC 190704A neutrino event. Its possible radio counterpart is NVSS J104938+274212 (SDSS J104938.80+274213.0, a galaxy at z = 0.144, Alam et al. (2015)). Parameters of VLBI observation are reported in Table A.1 and spectral indices deduced from these data are in Table A.2. The FIRST 1.4 GHz peak flux density is 9.2 mJy, and the integrated flux density is 15.6 mJy, suggesting that NVSS J104938+274212 contains a resolved radio structure on arcsecond scales (see Table 6). Our VLBI observations reveal a compact component on parsec scales, with a lower flux density than what is observed in the VLA surveys. The luminosity of the source at 1.5 GHz is (2.1±0.2)×1023 WHz−1, assuming a spectral index  .
.
Images parameters of VLBI observations.
Spectral index measured with VLBI data.
WISEA J111439.67+122503.7 One of the candidate γ-ray counterparts associated with IC 200109A is 4FGL J1114.6+1225 (Table 2). A possible counterpart of this source is WISEA J111439.67+122503.7, the properties of which are reported in Table 3. Among all the candidate counterparts associated with the events of our sample, this is the source located farthest from the position of the relative neutrino (about four degrees away from IC 200109A). This first leads us to disfavour it as the most promising candidate. Moreover, it is not catalogued as a blazar. We identified two radio counterparts in spatial coincidence with WISEA J111439.67+122503.7. In the following, we refer to them with WISEA J111439.67+122503.7-A and WISEA J111439.67+122503.7-B. Information about their arcsecond-scale, low-frequency properties are provided in Table 6.
WISEA J111439.67+122503.7-A Inspecting the highest resolution image of this source produced at 23.5 GHz, we resolved two components separated by about 8.4 mas. The second component was also detected in the 8.4 GHz images, while it is not detected in the 4.9 GHz image. In Table A.1, the properties of the VLBI observations of these components are reported. We use the suffix A1 for the brightest and A2 for the least bright detection. The spectral index between 8.4 GHz and 23.5 GHz of the A1 component is 1.4±0.1, while that of the A2 component is −1.4±0.4. From these results, we can speculate that we are looking at a self-absorbed core component (A1) and a contribution from a steep spectrum jet (A2). However, it must be noted that with these data we were not able to measure the spectral index adequately, that is, by adopting the same uv-range, pixel size, and restoring beam in the two frequency images. Then, the resulting spectral indices could be biased by the differences in the observation setups.
WISEA J111439.67+122503.7-B This source was not detected in our 8.4 GHz and 23.5 GHz observations. The upper limits set as three-times the rms noise levels of the images are 2.3 mJy and 80 μJy at 8.4 GHz and 23.5 GHz, respectively. At 4.9 GHz, the source is composed of two components (B1 and B2), located at a distance of around 7 mas from each other. The properties of these components are reported in Table A.1. Comparing these results to the low-frequency ones (Table 6), the source seems to be characterised by a steep spectrum.
WISEA J105553.74+103446.5 The other source within the error region of the IC 200109A event is WISEA J105553.74+103446.5 (Table 3). The possible radio counterpart observed by the VLBI shows a significant emission outside the core, as deduced by comparing the integrated flux density and the peak intensity at 4.9 GHz and 8.4 GHz (Table A.1). In our 23.5 GHz data, WISEA J105553.74+103446.5 lies under the rms noise level of the image, that is 0.9 mJy beam−1. The corresponding upper limit for the surface brightness of the source is 2.7 mJy beam−1. The NVSS, FIRST, and VLASS data reveal that a large fraction of the source emission is spread over arcsecond scales (Table 6). This is also confirmed by the steep spectral index obtained from our 4.9 GHz and 8.4 GHz data (Table A.2).
WISEA J065633.43+053922.7 The blazar-like source WISEA J065633.43+053922.7 is one of the possible IC 201114A counterparts (Giommi et al. 2020b). However, both the absence of a γ-ray association with this source and its position outside the 90% error region of the neutrino event (see Table 1) lead us to disfavour WISEA J065633.43+053922.7 as the best candidate. In the VLBI observations (Table A.1), the source shows a partially resolved structure with a core and a shallow emission extended towards the southwest. Due to the large beam size of the NVSS data, it results that the source emission is embedded with a close (∼44″) source in the field. In the VLASS, these two objects are separated. We measured the two contributions in NVSS data by fitting the object’s emission with two Gaussian components using the imfit tool of CASA. For completeness, we report the parameters of both the sources, labelled WISEA J065633.43+053922.7-A and WISEA J065633.43+053922.7-B, in Table 6. The target of our observation is WISEA J065633.43+053922.7-A. The contribution of WISEA J065633.43+053922.7-B is not detected in our VLBI data. Table A.2 reports the VLBI spectral indices of the main target source. We confirm the blazar nature of this source, based on the large core prominence (as indicated by the comparison of the VLBI and NVSS/VLASS flux densities) and the behaviour of the spectral index, which is inverted at low frequencies and flat at higher frequencies.
NVSS J065916+055252 The second blazar candidate associated with IC 201114A is NVSS J065916+055252 (Giommi et al. 2020b). This source is not associated with any γ-ray detection either (Table 3). In our VLBI observations, NVSS J065916+055252 is composed of a bright core and an elongated jet that extends in the northwest. In Table A.1, we report VLBI properties of this source. Survey data show that this source is core-dominated at arcsecond scales (Table 6). The VLASS flux densities in the two epochs (2017 and 2020, two months before the neutrino detection) are consistent within the errors, implying the absence of variability at VLASS scales in that time range. In Table A.2, we report the spectral index measurements.
Appendix B: Model fit parameters
In this section, we report the model-fit parameters of the three jetted sources, TXS 1100+122, PKS 1725+123 and NVSS J065844+063711. These results are presented in Sect. 4 and discussed in Sect. 5.
Model fit component parameters of TXS 1100+122.
Model-fit component parameters of PKS 1725+123.
Model-fit component parameters of NVSS J065844+063711.
All Tables
Information on other-wavelength associations with the candidate counterparts of neutrino events.
Variability index calculated between our VLBI observations and RFC observations.
All Figures
|
Fig. 1. 1WHSP J104516.2+275133 total radio flux density at different frequencies and epochs. |
| In the text | |
|
Fig. 2. TXS 1100+122 total radio flux density at different frequencies and epochs. |
| In the text | |
|
Fig. 3. EVN-4.9 GHz and VLBA-8.4 GHz and VLBA-23.5 GHz contour images of TXS 1100+122. The contour levels are drawn from 3 × the rms noise of the images. Contours increase by a factor of 2. The noise level and the beam size of each image are reported in Cols. 7 and 8 of Table 7. The black ellipse in the bottom left corner represents the restoring beam. |
| In the text | |
|
Fig. 4. e-MERLIN contour image of PKS 1725+123. The contour levels are drawn from 3× the rms noise of the images and increase by a factor of 2. The noise level and the beam size of the image are reported in Cols. 7 and 8 of Table 7. The black ellipse in the bottom left corner represents the restoring beam. |
| In the text | |
|
Fig. 5. EVN-4.9 GHz and VLBA-8.4 and −23.5 GHz contour images of NVSS J065844+063711. The contour levels are drawn starting from 3× the rms and are spaced by power of two. The noise level and the beam size of each image are reported in Cols. 7 and 8 of Table 7. The black ellipse in the bottom left corner represents the restoring beam. |
| In the text | |
|
Fig. 6. NVSS J065844+063711 total radio flux density at different frequencies and epochs. |
| In the text | |
Current usage metrics show cumulative count of Article Views (full-text article views including HTML views, PDF and ePub downloads, according to the available data) and Abstracts Views on Vision4Press platform.
Data correspond to usage on the plateform after 2015. The current usage metrics is available 48-96 hours after online publication and is updated daily on week days.
Initial download of the metrics may take a while.