Fig. 9.
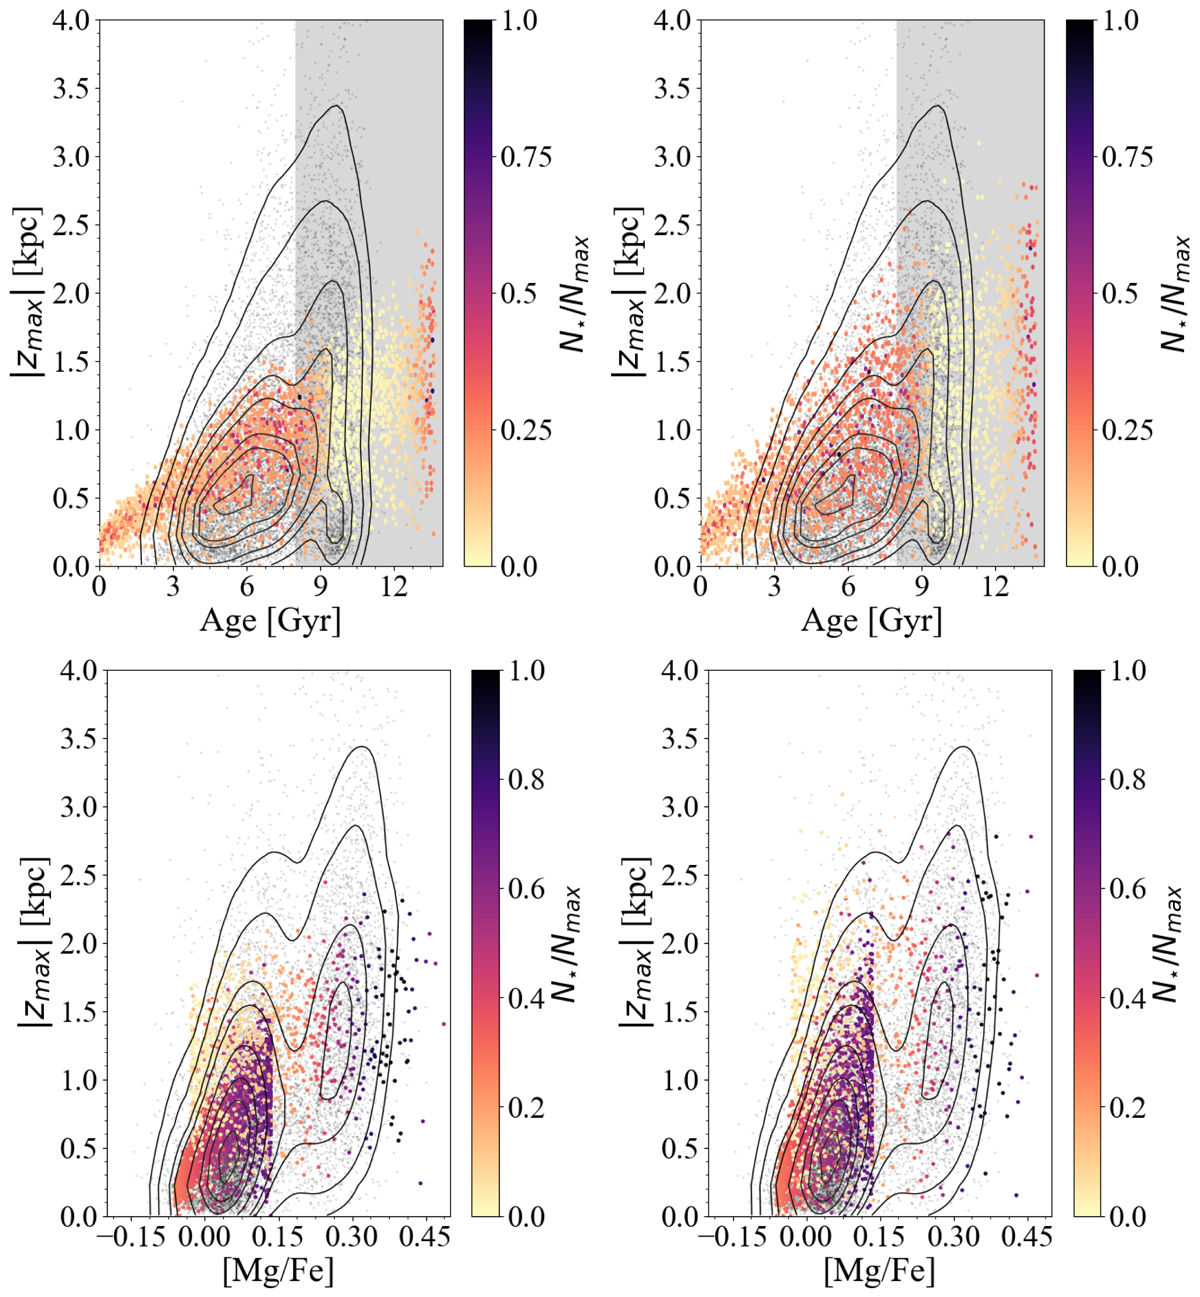
Download original image
The inclusion of the dispersion in the vertical action Jz estimates in the Ting & Rix (2019) relation. Upper panels: vertical maximum excursion |zmax| versus age relation for the ES21 model. The grey points indicate stars within the Galactocentric region between 6 and 10 kpc and |z|< 2 kpc as reported in the astroNN catalogue. The contour lines enclose fractions of 0.95, 0.90, 0.75, 0.60, 0.45, 0.30, 0.20, and 0.05 of the total number of observed stars. The colour coding represents the total number of stars predicted by the ES21 model in that region. In the left panel, we draw model results considering a Gaussian error (see Eq. (5)) with standard deviation σJz = 0.5 ⋅ Jz, whereas in the right panel we assume σJz = 1 ⋅ Jz. The shaded grey area highlights the region with ages of more than 8 Gyr, for which the use of Eq. (3) may not be justified. Lower panels: as in the upper ones, but for the |zmax| versus [Mg/Fe] relations.
Current usage metrics show cumulative count of Article Views (full-text article views including HTML views, PDF and ePub downloads, according to the available data) and Abstracts Views on Vision4Press platform.
Data correspond to usage on the plateform after 2015. The current usage metrics is available 48-96 hours after online publication and is updated daily on week days.
Initial download of the metrics may take a while.