Fig. 6.
Download original image
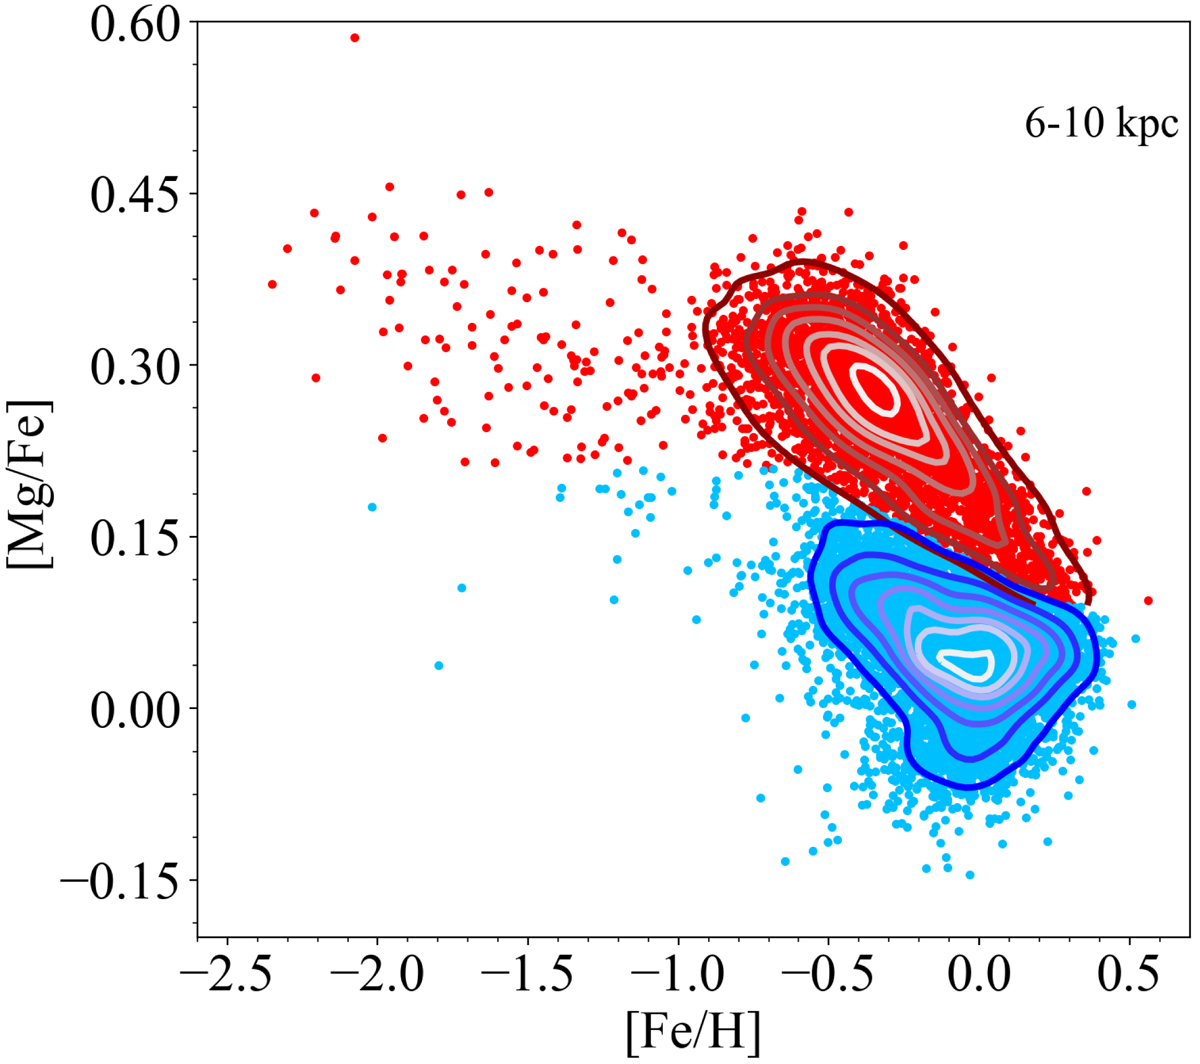
Disc components selected based on the chemistry of the APOGEE stars in the Galactic region enclosed between 6 and 10 kpc presented in Sect. 2. Red points show high-α sequence stars, and light blue points show the low-α ones. The contour lines enclose fractions of 0.95, 0.90, 0.75, 0.60, 0.45, 0.30, 0.20, and 0.05 of the total number of observed stars for the two sequences, separately.
Current usage metrics show cumulative count of Article Views (full-text article views including HTML views, PDF and ePub downloads, according to the available data) and Abstracts Views on Vision4Press platform.
Data correspond to usage on the plateform after 2015. The current usage metrics is available 48-96 hours after online publication and is updated daily on week days.
Initial download of the metrics may take a while.