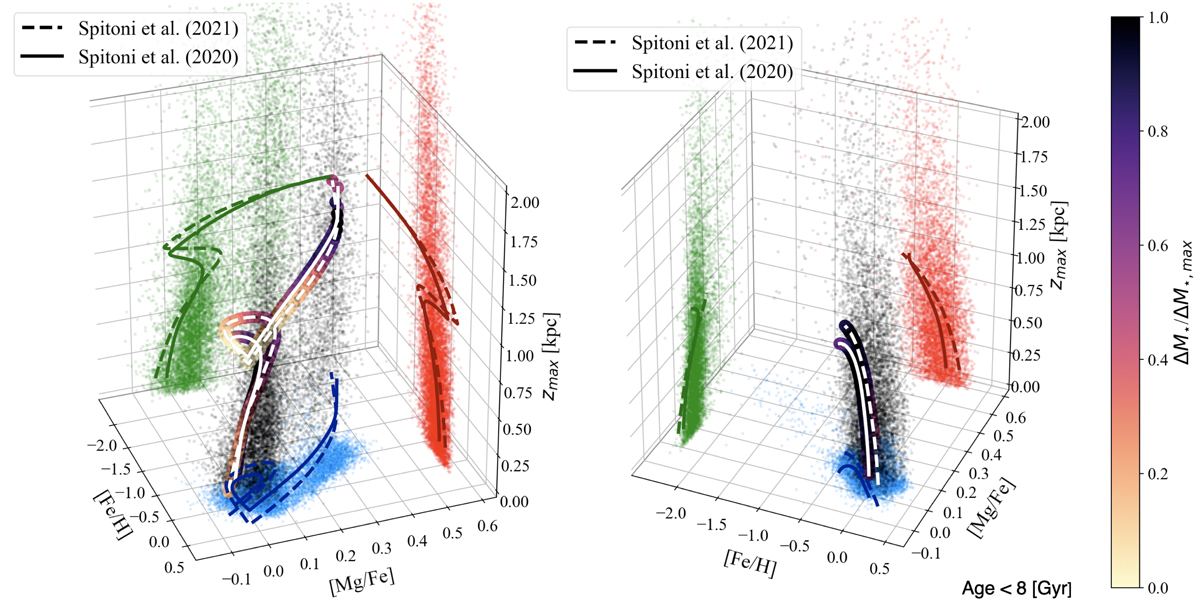
Fig. 15.
Download original image
Observed stars (grey points) in the 3D space formed by APOGEE DR16 abundance ratios (i.e. [Fe/H] and [Mg/Fe]) and maximum vertical excursion from the midplane |zmax| (from astroNN catalogue) in the Galactic region between 6 and 10 kpc with |z|< 2 kpc compared with model predictions by ES20 and ES21 (white solid and dashed lines, respectively). The associated projections are drawn with red, blue, and green points (data) and lines (models), respectively. In the left panel all the stellar ages have been considered, while in the right one only observed and predicted stars younger than 8 Gyr have been drawn. In both panels, the colour-coded points indicate the predicted surface stellar mass density ΔM⋆ formed in constant age intervals fixed at the value of 0.05 Gyr normalised to the maximum value ΔM⋆, max.
Current usage metrics show cumulative count of Article Views (full-text article views including HTML views, PDF and ePub downloads, according to the available data) and Abstracts Views on Vision4Press platform.
Data correspond to usage on the plateform after 2015. The current usage metrics is available 48-96 hours after online publication and is updated daily on week days.
Initial download of the metrics may take a while.