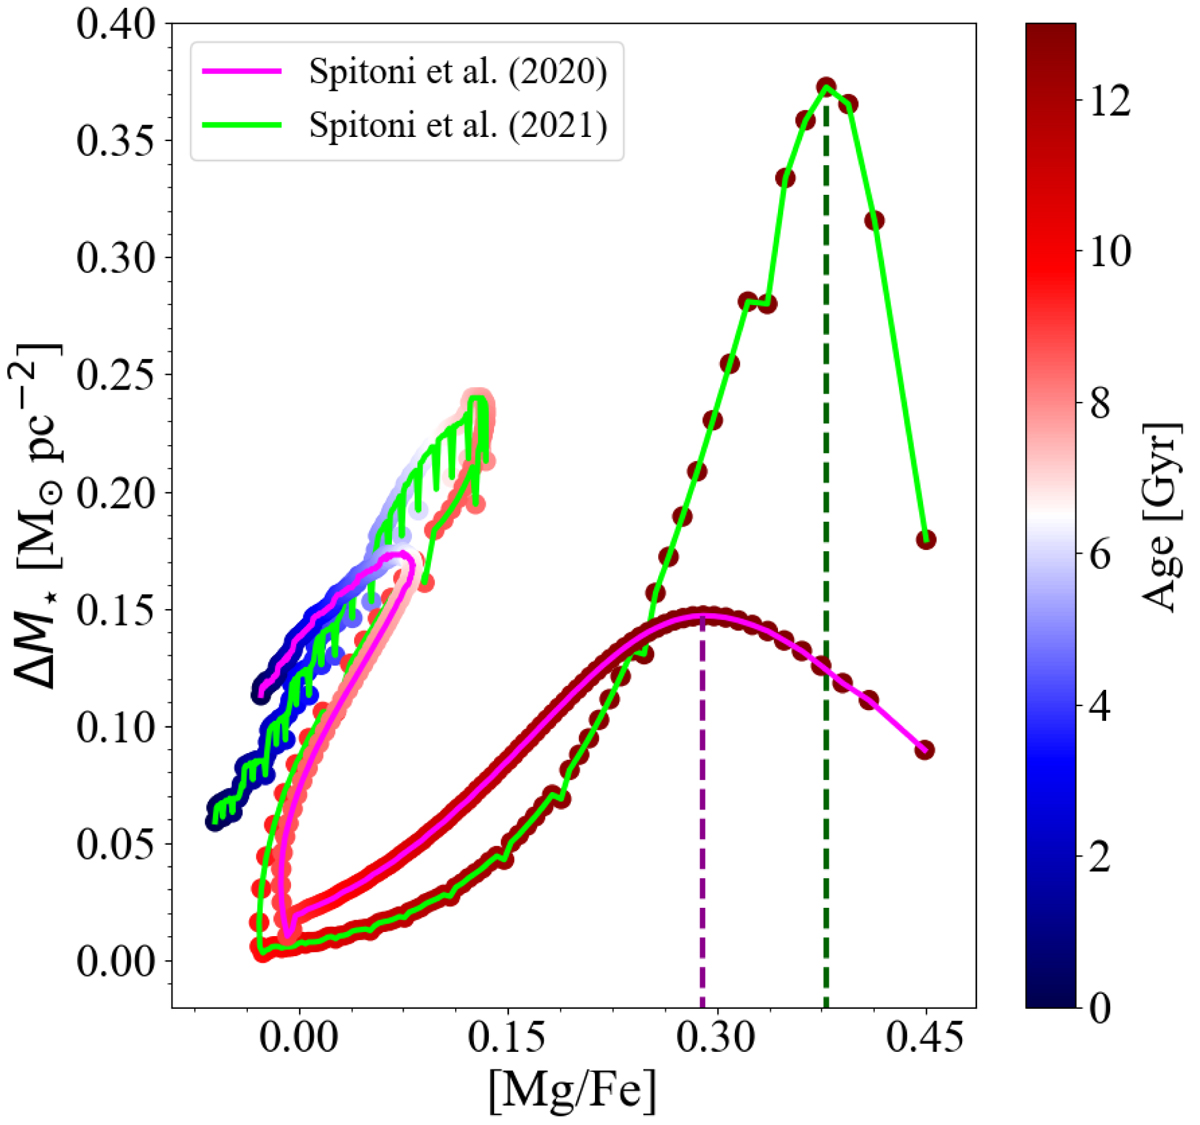
Fig. 11.
Download original image
Predicted surface stellar mass density ΔM⋆ formed in age intervals of 0.05 Gyr as a function of the [Mg/Fe] abundance ratio predicted by the ES21 model (green solid line) and by the M2 model of ES20 (magenta solid line). Colour-coded points correspond to different ages of the SSPs. Vertical dashed lines depict the associated maximum ΔM⋆ values in the high-α sequence stars.
Current usage metrics show cumulative count of Article Views (full-text article views including HTML views, PDF and ePub downloads, according to the available data) and Abstracts Views on Vision4Press platform.
Data correspond to usage on the plateform after 2015. The current usage metrics is available 48-96 hours after online publication and is updated daily on week days.
Initial download of the metrics may take a while.