Open Access
Fig. 6
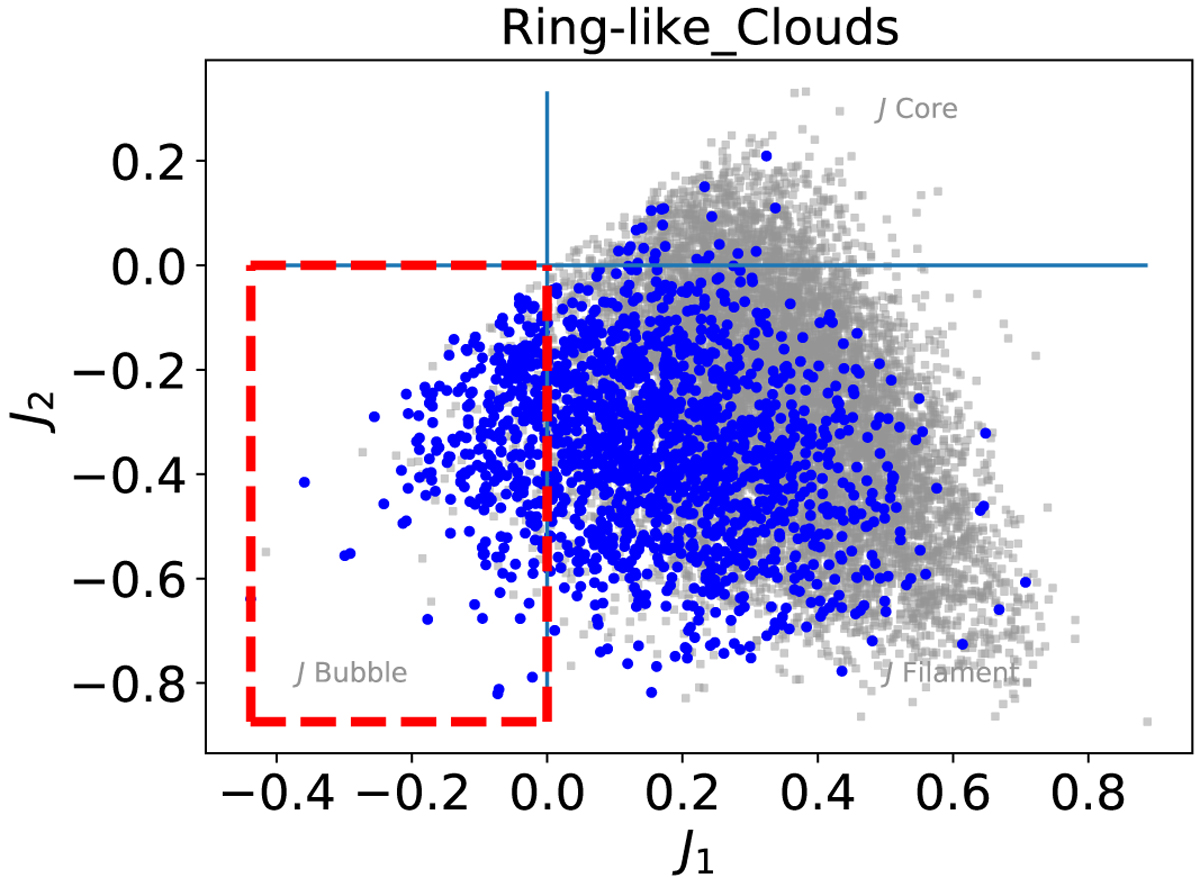
Download original image
J plot for the visual class ring-like clouds. The blue dots represent the ring-like clouds, and the grey dots represent all the clouds in VC sample. The blue dots lying inside the red dashed rectangle represent the MR sample.
Current usage metrics show cumulative count of Article Views (full-text article views including HTML views, PDF and ePub downloads, according to the available data) and Abstracts Views on Vision4Press platform.
Data correspond to usage on the plateform after 2015. The current usage metrics is available 48-96 hours after online publication and is updated daily on week days.
Initial download of the metrics may take a while.