Fig. 12
Download original image
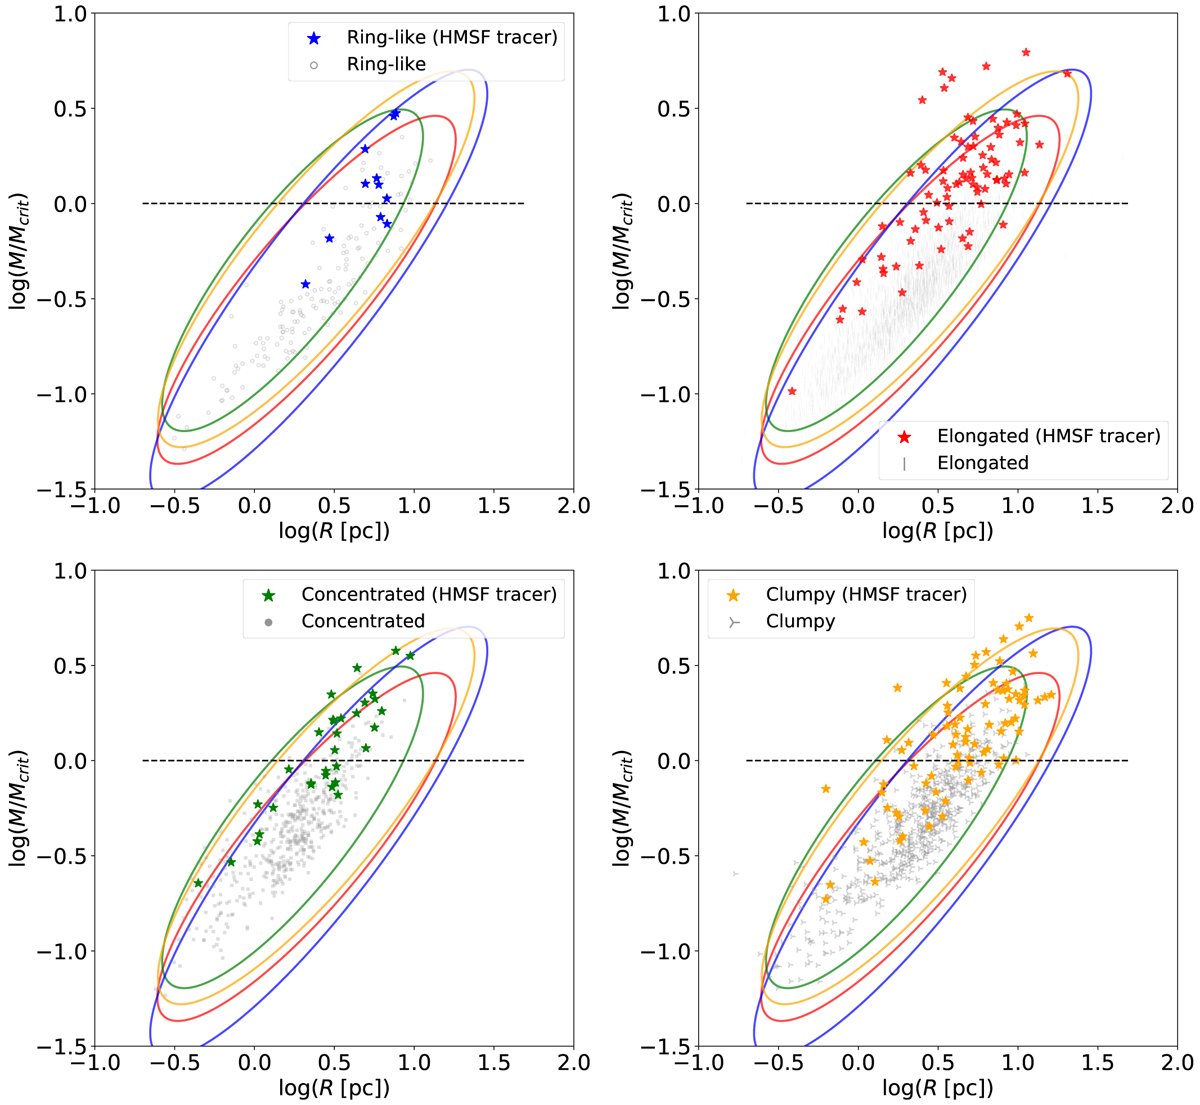
HMSF threshold (dashed line; M[M⊙] = 1053 (R[pc])1.33) for molecular clouds using the MR (science) sample. The y axis represents M/Mcrit, where Mcrit = 1053 (R[pc])1.33 is the HMSF threshold. The coloured ellipses encompass approximately 99.7% of the data points and represent three-sigma levels for the cloud morphologies, which are indicated by the legends in the four plots. The clouds with HMSF tracers (Table 9) are denoted by a star (⋆).
Current usage metrics show cumulative count of Article Views (full-text article views including HTML views, PDF and ePub downloads, according to the available data) and Abstracts Views on Vision4Press platform.
Data correspond to usage on the plateform after 2015. The current usage metrics is available 48-96 hours after online publication and is updated daily on week days.
Initial download of the metrics may take a while.