Fig. 2.
Download original image
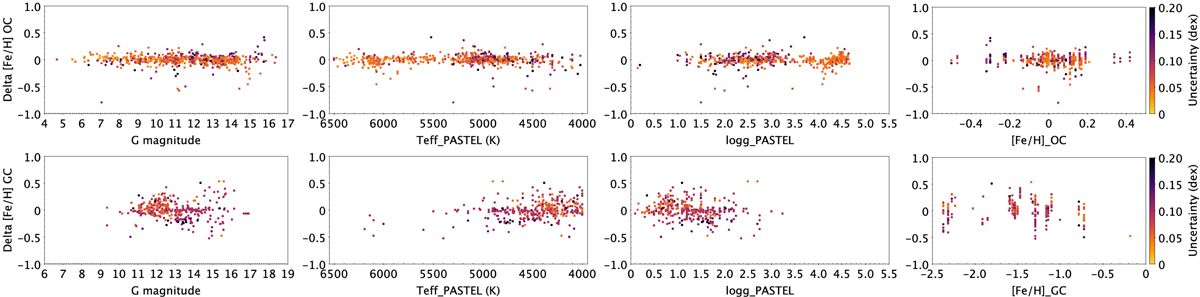
Difference between mean PASTEL determinations of [Fe/H] for individual members and the mean value per cluster from Netopil et al. (2016) for OCs (upper panel) and from Harris (2010) for GCs (bottom panel) versus G magnitude, Teff, log g from PASTEL, and the mean [Fe/H] per cluster. The colour is related to the [Fe/H] uncertainty from PASTEL.
Current usage metrics show cumulative count of Article Views (full-text article views including HTML views, PDF and ePub downloads, according to the available data) and Abstracts Views on Vision4Press platform.
Data correspond to usage on the plateform after 2015. The current usage metrics is available 48-96 hours after online publication and is updated daily on week days.
Initial download of the metrics may take a while.