Open Access
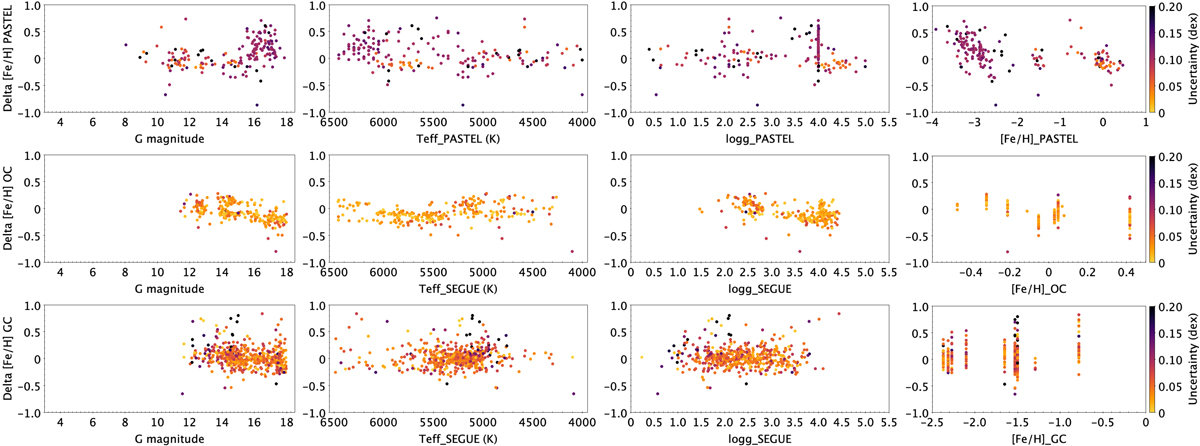
Fig. 10.
Download original image
Same as Fig. 3 but for SEGUE. The multiple stars at log g = 4.0 in the PASTEL plot come from one bibliographical reference, a high-resolution spectroscopic follow-up of extremely metal-poor stars from SEGUE (Aoki et al. 2013), which assumed the surface gravity for all turn-off stars to be that value.
Current usage metrics show cumulative count of Article Views (full-text article views including HTML views, PDF and ePub downloads, according to the available data) and Abstracts Views on Vision4Press platform.
Data correspond to usage on the plateform after 2015. The current usage metrics is available 48-96 hours after online publication and is updated daily on week days.
Initial download of the metrics may take a while.