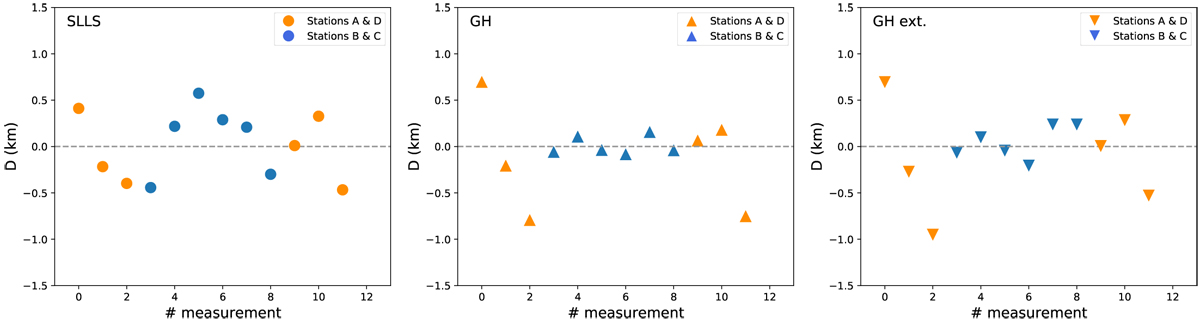
Fig. 6
Download original image
Values of the orthogonal distances calculated for each approach following Eq. (11). From left to right: computed values for the SLLS method, the GH, and the GH with the extended stochastic model are shown, respectively. Highlighted symbols in orange indicate calculated values derived from low-resolution observations, i.e. measurements obtained from stations A and D. The straight dashed line represents the estimated trajectory line for each approach.
Current usage metrics show cumulative count of Article Views (full-text article views including HTML views, PDF and ePub downloads, according to the available data) and Abstracts Views on Vision4Press platform.
Data correspond to usage on the plateform after 2015. The current usage metrics is available 48-96 hours after online publication and is updated daily on week days.
Initial download of the metrics may take a while.