Fig. 9.
Download original image
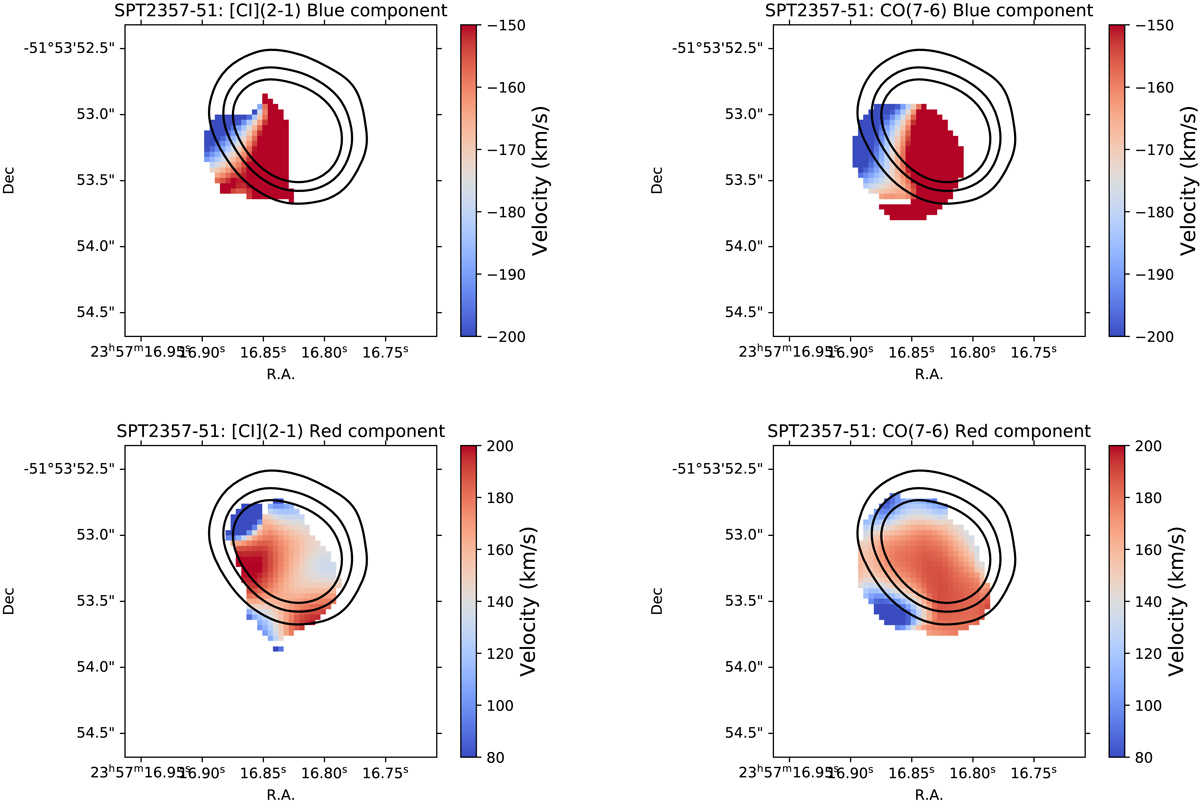
Decomposition of the CO(7−6) and [CI](2−1) lines in SPT2357−51. The central velocity of each component from the Gaussian fitting is shown above. The fitting procedure is described in Sect. 5.3. The 3, 5, and 10σ contours from the continuum map are also plotted on the maps. We see a smooth velocity gradient for the blue component, but no discernible pattern in the red component.
Current usage metrics show cumulative count of Article Views (full-text article views including HTML views, PDF and ePub downloads, according to the available data) and Abstracts Views on Vision4Press platform.
Data correspond to usage on the plateform after 2015. The current usage metrics is available 48-96 hours after online publication and is updated daily on week days.
Initial download of the metrics may take a while.