Open Access
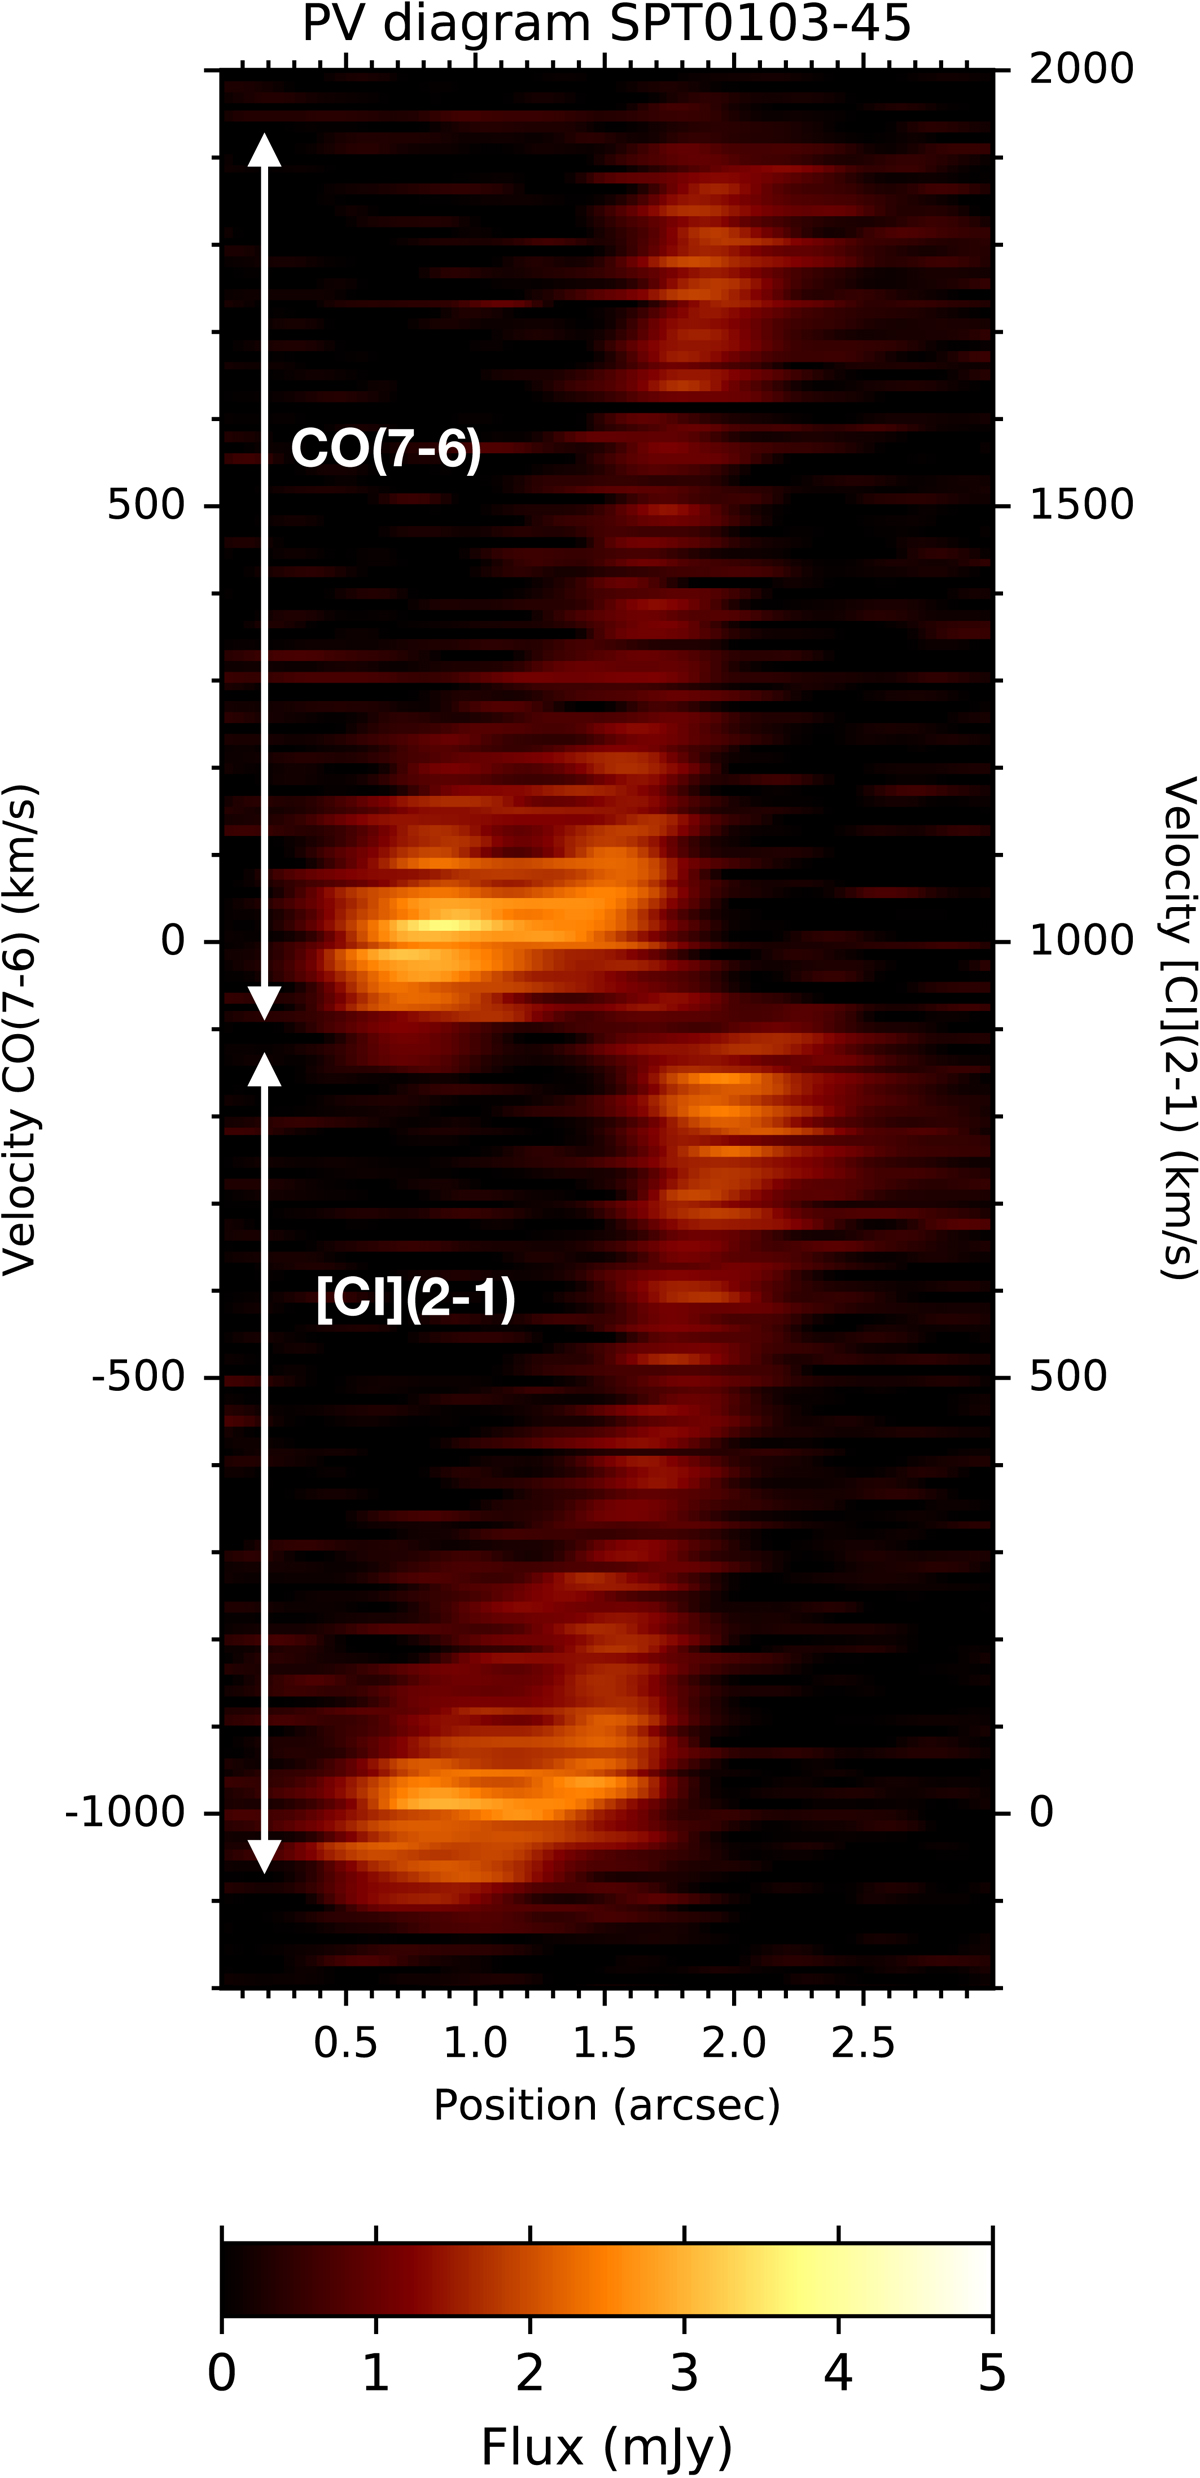
Fig. 6.
Download original image
Position-velocity diagram of SPT0103−45. The axis used to make this diagram is shown in the first panel of Fig. 4. The velocity axis on the left y-axis has the zero-velocity of the CO(7−6) observed frequency and the right y-axis has the zero-velocity centred at the [CI](2−1) observed frequency.
Current usage metrics show cumulative count of Article Views (full-text article views including HTML views, PDF and ePub downloads, according to the available data) and Abstracts Views on Vision4Press platform.
Data correspond to usage on the plateform after 2015. The current usage metrics is available 48-96 hours after online publication and is updated daily on week days.
Initial download of the metrics may take a while.