Fig. 4.
Download original image
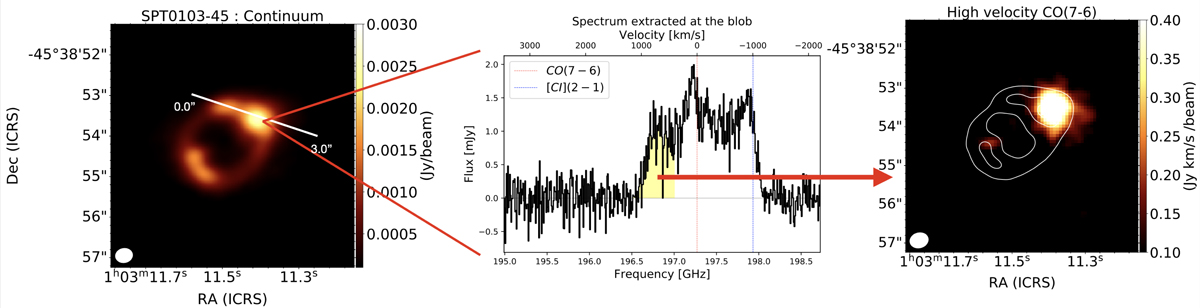
Properties of the ‘gem’ in SPT0103−45. Left panel: is the continuum map as described in Sect. 3.2. The white line shows the direction along with the slice for the PV diagram is extracted (Fig. 6). The spectrum shown in the centre panel is extracted at the coordinates of the gem (Sect. 3.3). The frequency range represented by the yellow region is used to compute the integrated intensity of the high-velocity emission, represented in the right panel. The white contours are the 5, 10 and 15σ contours of the continuum emission.
Current usage metrics show cumulative count of Article Views (full-text article views including HTML views, PDF and ePub downloads, according to the available data) and Abstracts Views on Vision4Press platform.
Data correspond to usage on the plateform after 2015. The current usage metrics is available 48-96 hours after online publication and is updated daily on week days.
Initial download of the metrics may take a while.