Fig. 3.
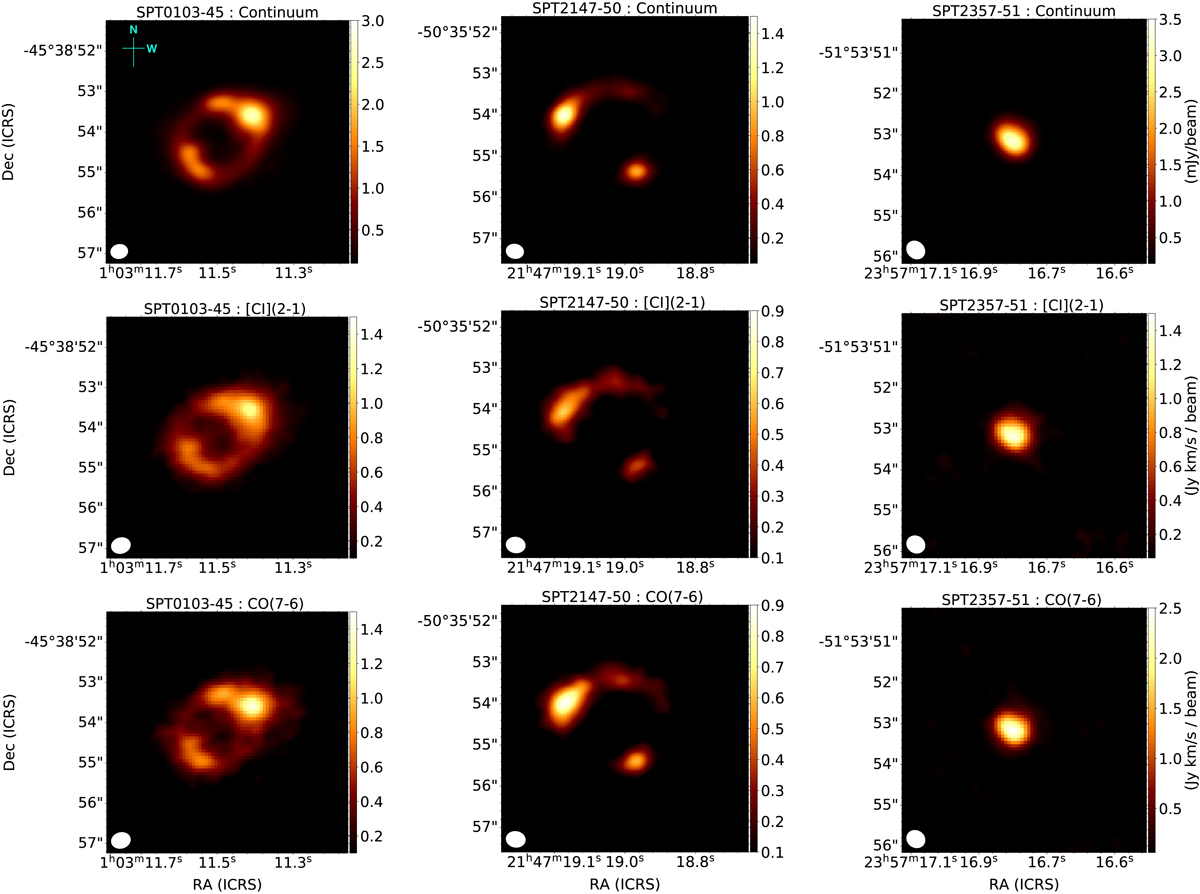
Download original image
Continuum and moment-0 maps of our sample. First row: continuum maps of (from left to right) SPT0103−45, SPT2147−50, and SPT2357−51 (see Sect. 3.2). The synthesised beam is represented as the white ellipse on the bottom left of every map. Second row: is the integrated [CI](2−1) intensity maps. Third row: is the integrated CO(7−6) intensity maps of our sources (see Sect. 4.3).
Current usage metrics show cumulative count of Article Views (full-text article views including HTML views, PDF and ePub downloads, according to the available data) and Abstracts Views on Vision4Press platform.
Data correspond to usage on the plateform after 2015. The current usage metrics is available 48-96 hours after online publication and is updated daily on week days.
Initial download of the metrics may take a while.