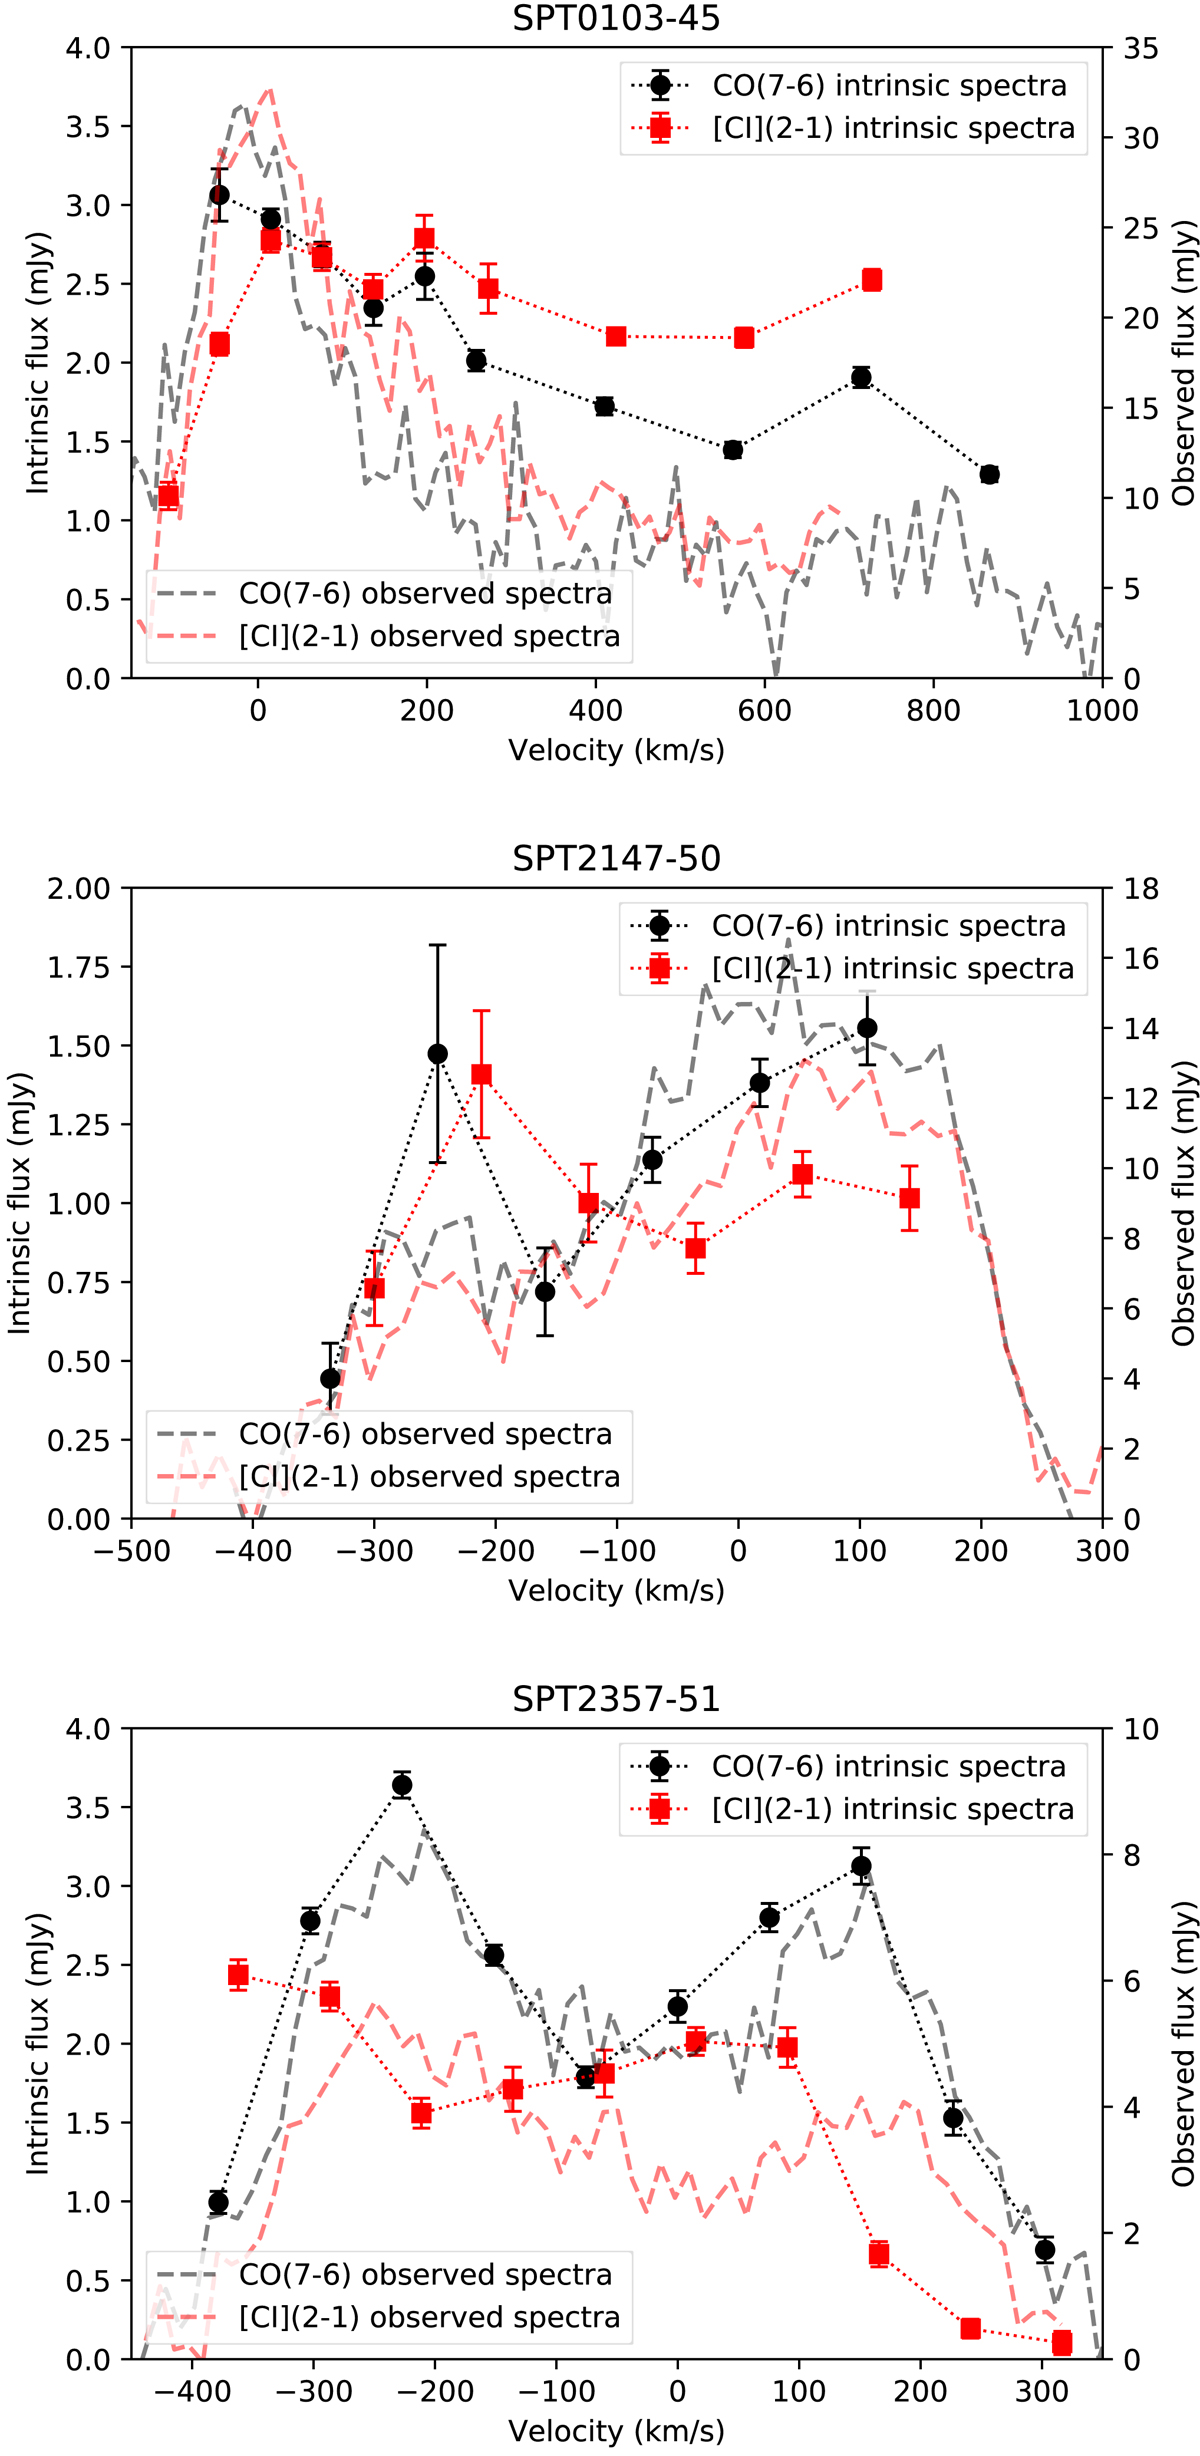
Fig. D.1.
Download original image
The intrinsic spectra for the [CI](2-1) line (red filled squares) and the CO(7-6) line (black filled circles). The top panel shows the results for SPT0103-45. The middle panel shows the results of SPT2147-50 and the bottom panel for SPT2357-51. We overplot the observed spectra using a dashed-line, red for [CI](2-1) and black for CO(7-6).
Current usage metrics show cumulative count of Article Views (full-text article views including HTML views, PDF and ePub downloads, according to the available data) and Abstracts Views on Vision4Press platform.
Data correspond to usage on the plateform after 2015. The current usage metrics is available 48-96 hours after online publication and is updated daily on week days.
Initial download of the metrics may take a while.