Open Access
Fig. B.1.
Download original image
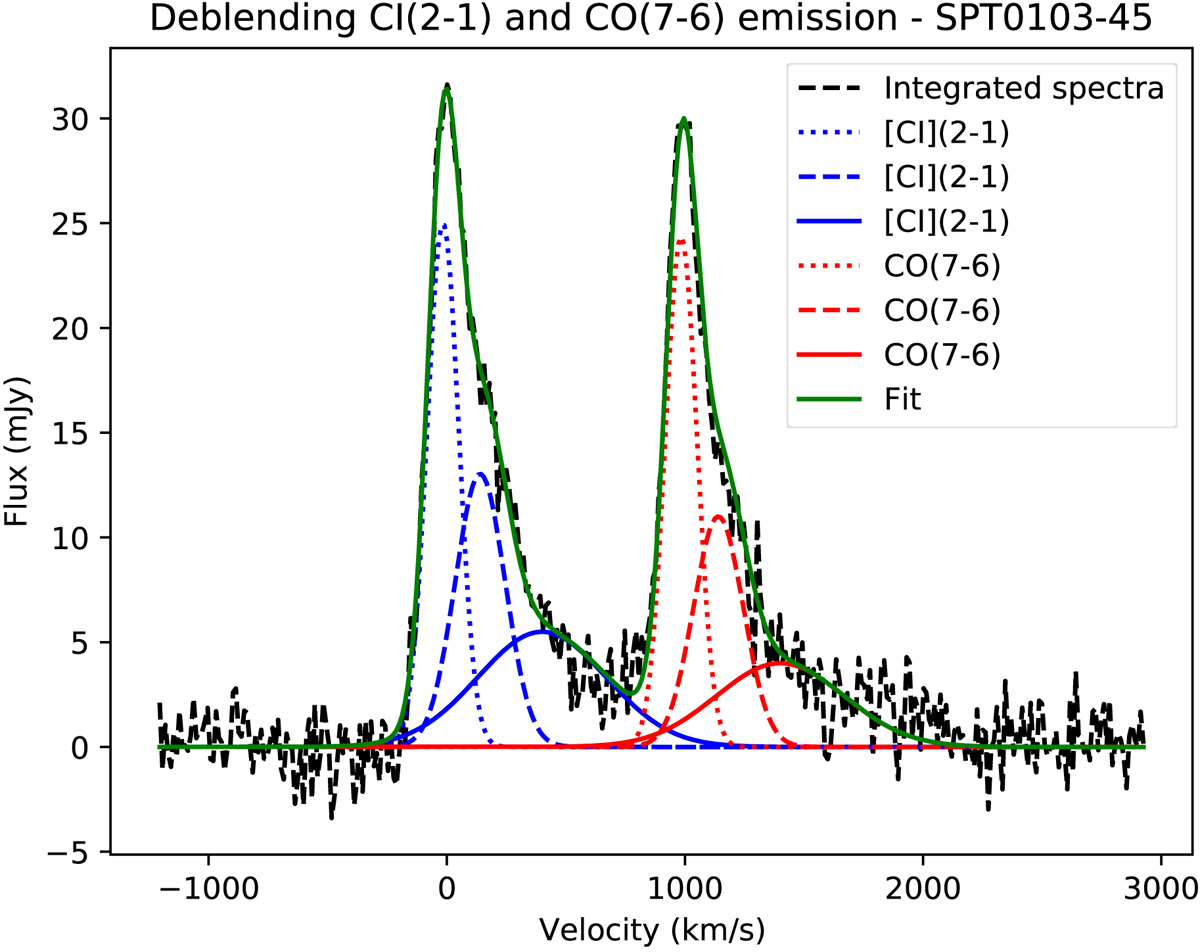
The Gaussian deblending of the CO and [CI] spectrum of SPT0103-45. Each of the lines are fitted with 3 Gaussian profiles. The blue fit represents the [CI](2-1) line and the red fit is the CO(7-6) line fit. The green line represents the total of both lines.
Current usage metrics show cumulative count of Article Views (full-text article views including HTML views, PDF and ePub downloads, according to the available data) and Abstracts Views on Vision4Press platform.
Data correspond to usage on the plateform after 2015. The current usage metrics is available 48-96 hours after online publication and is updated daily on week days.
Initial download of the metrics may take a while.