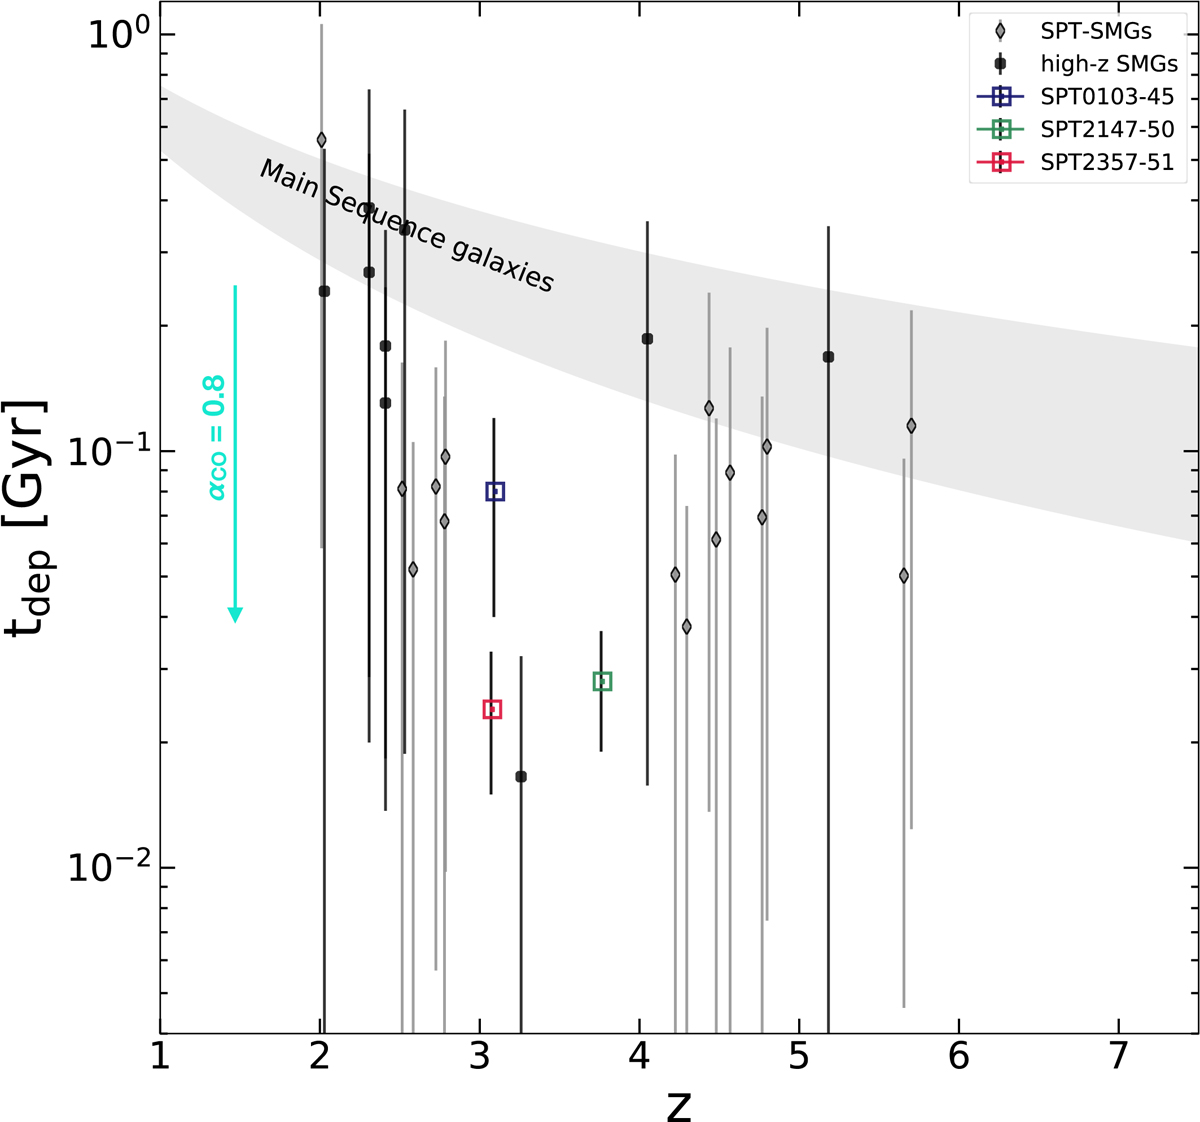
Fig. 17.
Download original image
The depletion timescale versus redshift of our sources, compared with other SPT-SMGs and other high-z SMGs. The depletion timescales for our sources are computed with the gas mass estimated from low-J CO fluxes with an αCO = 0.8. The grey shaded region represents the evolution of the depletion timescale with redshifts for main sequence galaxies. This plot is adapted from Jarugula et al. (2021). The high-redshift gravitationally lensed SPT-SMGs are from Aravena et al. (2016) and Reuter et al. (2020) and the other high-redshift SMGs are taken from Carilli et al. (2010), Walter et al. (2012), Fu et al. (2012, 2013), Ivison et al. (2013), Alaghband-Zadeh et al. (2013). The main sequence galaxies are described in Saintonge et al. (2013) as tdep = 1.5 (1 + z) α, where α is from −1.5 (Davé et al. 2012) to −1.0 (Magnelli et al. 2013), which is shown as the grey shaded region.
Current usage metrics show cumulative count of Article Views (full-text article views including HTML views, PDF and ePub downloads, according to the available data) and Abstracts Views on Vision4Press platform.
Data correspond to usage on the plateform after 2015. The current usage metrics is available 48-96 hours after online publication and is updated daily on week days.
Initial download of the metrics may take a while.