Fig. 16.
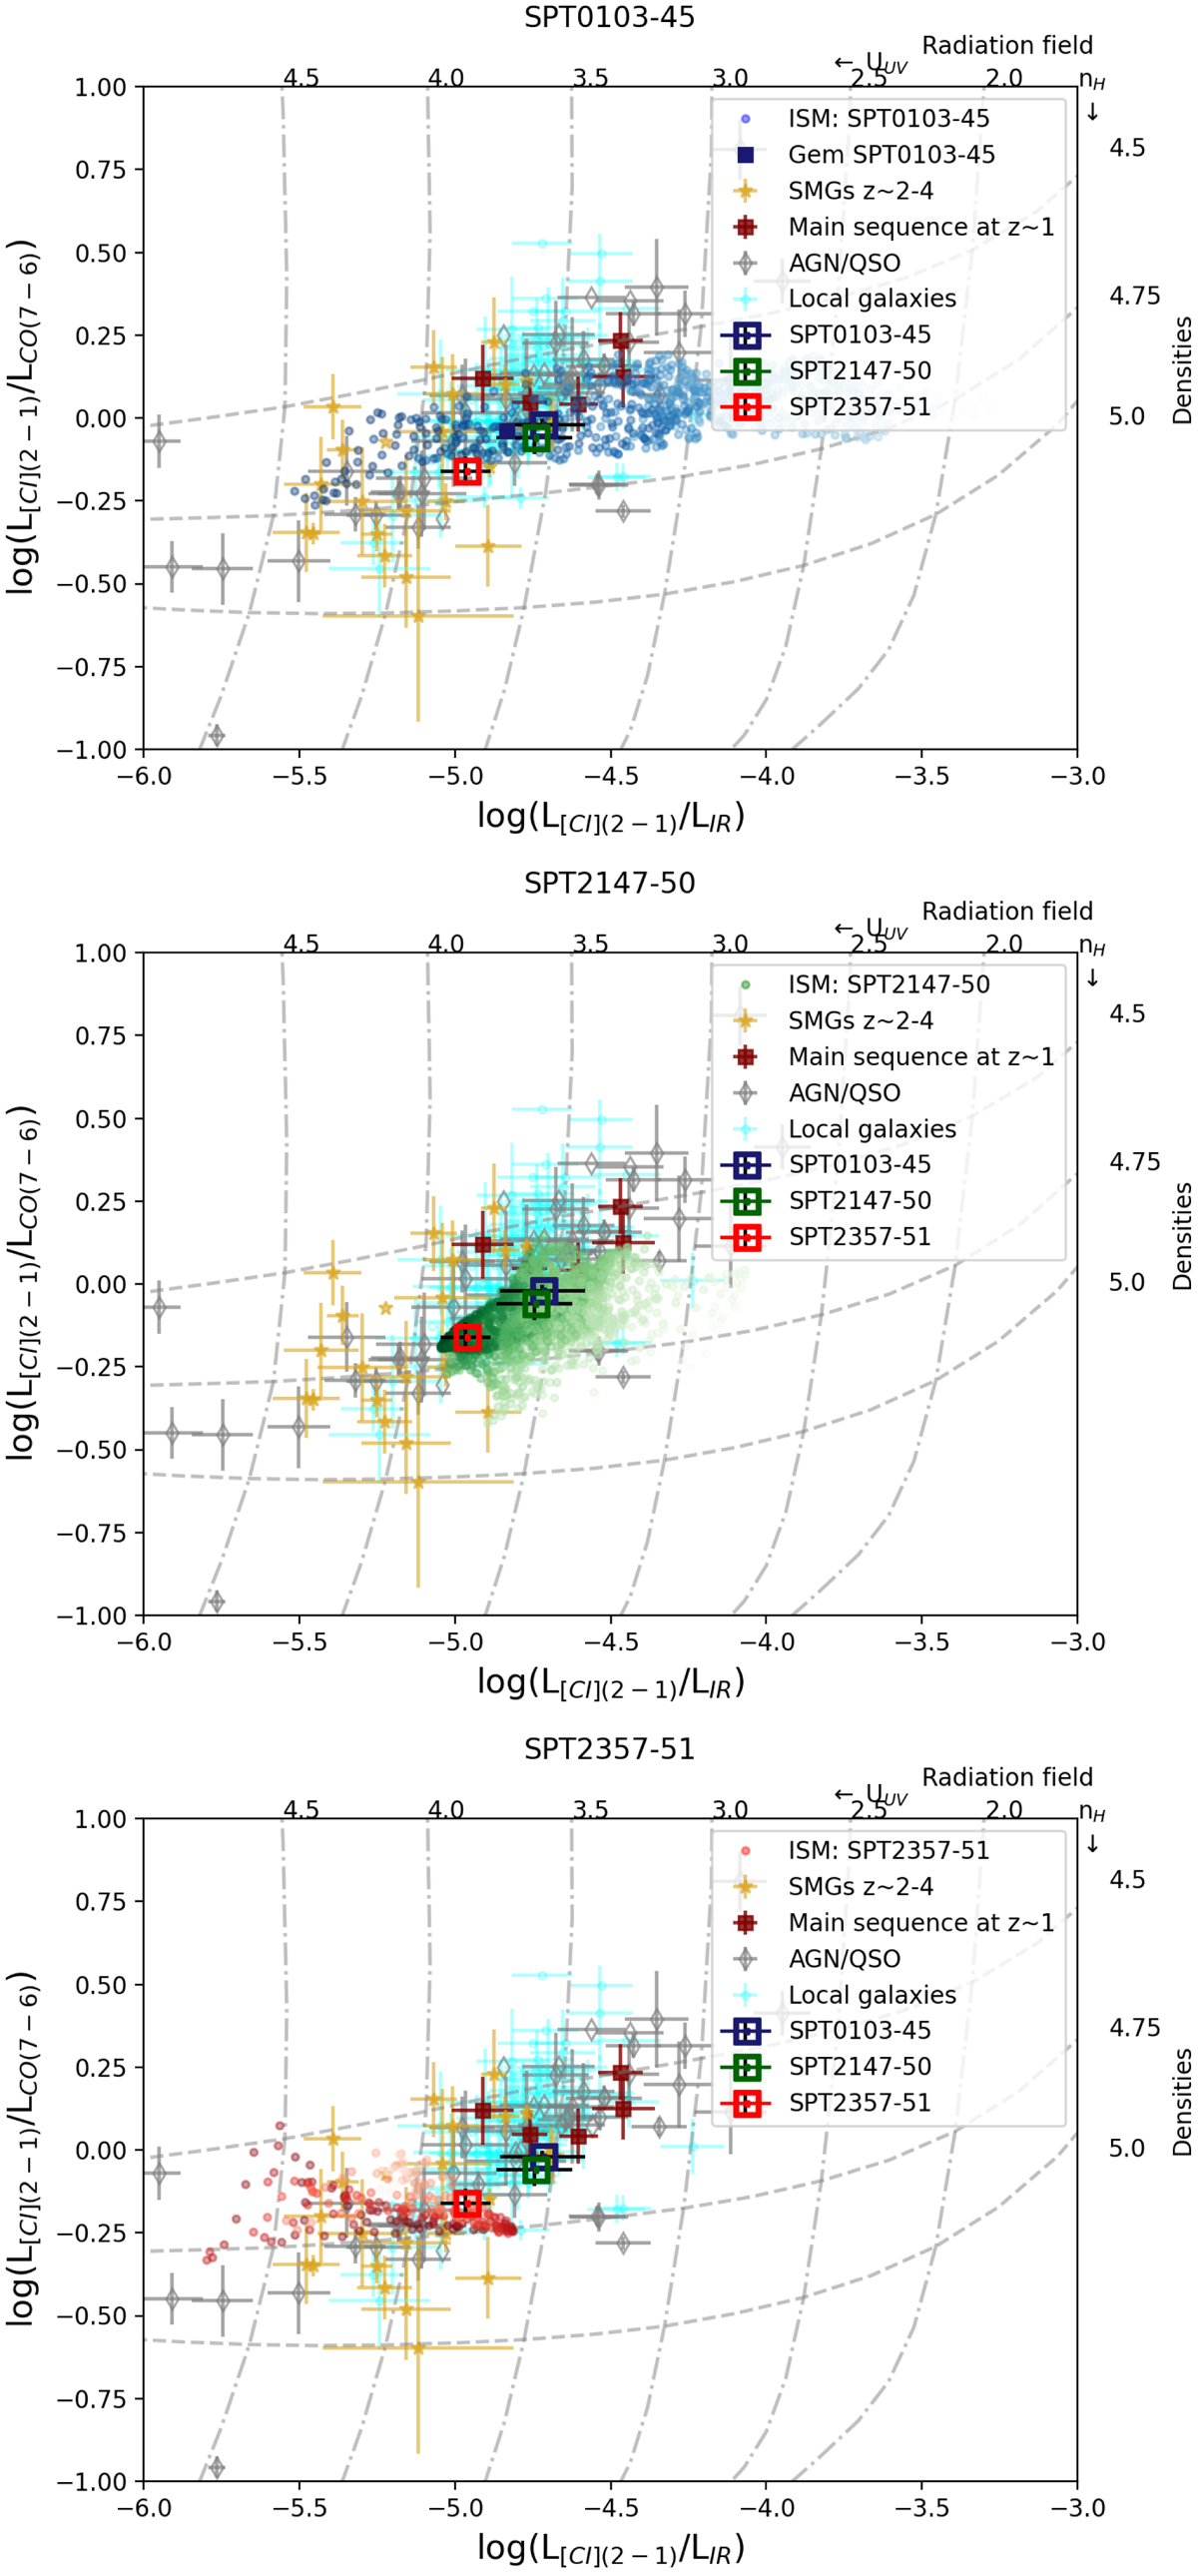
Download original image
L[CI](2 − 1)/LCO(7 − 6) versus L[CI](2 − 1)/LIR for our sources, SPT0103−45 (top) SPT2147−50 (middle), and SPT2357−51 (bottom). The global ratios of our sources are represented as squares. The pixel-wise ratios of our sources are represented as small dots. We note that since we use the data in each pixel and not each beam, the data points are not independent. The pixel-wise values are colour-coded based on the LIR of each pixel, with the darkest corresponding to the most luminous pixels. We compare our sources with the compilation presented in Valentino et al. (2020). The SMGs at z ∼ 2 − 4 are represented by golden stars (Walter et al. 2011; Alaghband-Zadeh et al. 2013; Bothwell et al. 2017; Yang et al. 2017; Andreani et al. 2018; Cañameras et al. 2018; Nesvadba et al. 2019; Dannerbauer et al. 2019; Jin et al. 2019). The main-sequence galaxies at z ∼ 1 are represented by maroon squares (Valentino et al. 2018, 2020; Bourne et al. 2019). The local FTS samples of star-forming galaxies are represented by aqua dots (Liu et al. 2015; Kamenetzky et al. 2014) and local FTS samples with AGN signatures are represented by grey diamonds (Véron-Cetty & Véron 2010; Liu et al. 2015; Kamenetzky et al. 2014). The grey dot-dashed and dashed lines are the isocontours of the UV radiation field (UUV) and the hydrogen density (nH) from the PDR models of Kaufman et al. (1999) in logarithmic values.
Current usage metrics show cumulative count of Article Views (full-text article views including HTML views, PDF and ePub downloads, according to the available data) and Abstracts Views on Vision4Press platform.
Data correspond to usage on the plateform after 2015. The current usage metrics is available 48-96 hours after online publication and is updated daily on week days.
Initial download of the metrics may take a while.