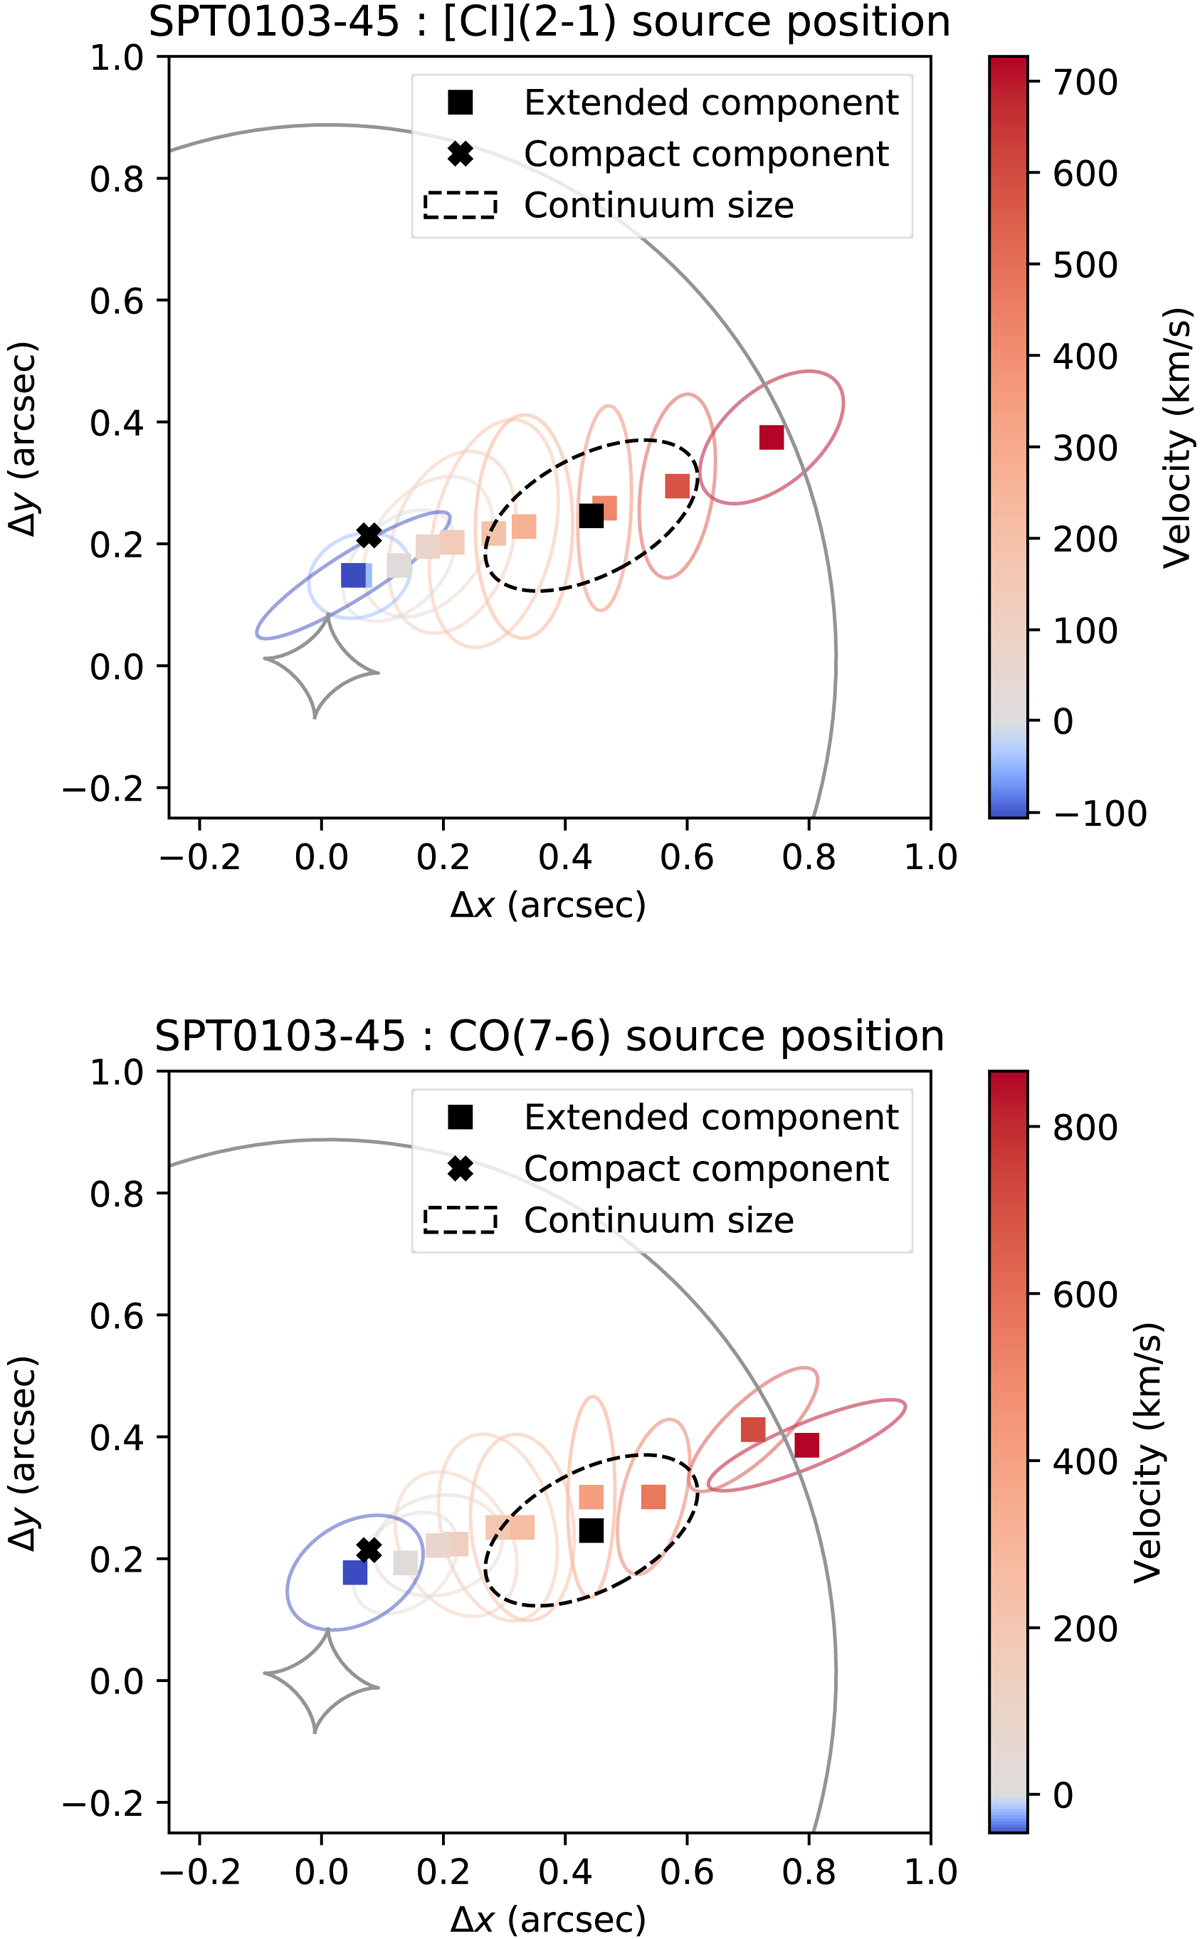
Fig. 11.
Download original image
Best-fit source positions of the channelised models of [CI](2−1) (top) and CO(7−6) (bottom) in SPT0103−45. The velocity scaled is the central velocity of each of the bins. The black square and cross, represent the positions of the extended and compact component from the continuum model, respectively. The ellipses represent the half-light ellipses of each of the model. The lensing caustics are shown in grey.
Current usage metrics show cumulative count of Article Views (full-text article views including HTML views, PDF and ePub downloads, according to the available data) and Abstracts Views on Vision4Press platform.
Data correspond to usage on the plateform after 2015. The current usage metrics is available 48-96 hours after online publication and is updated daily on week days.
Initial download of the metrics may take a while.