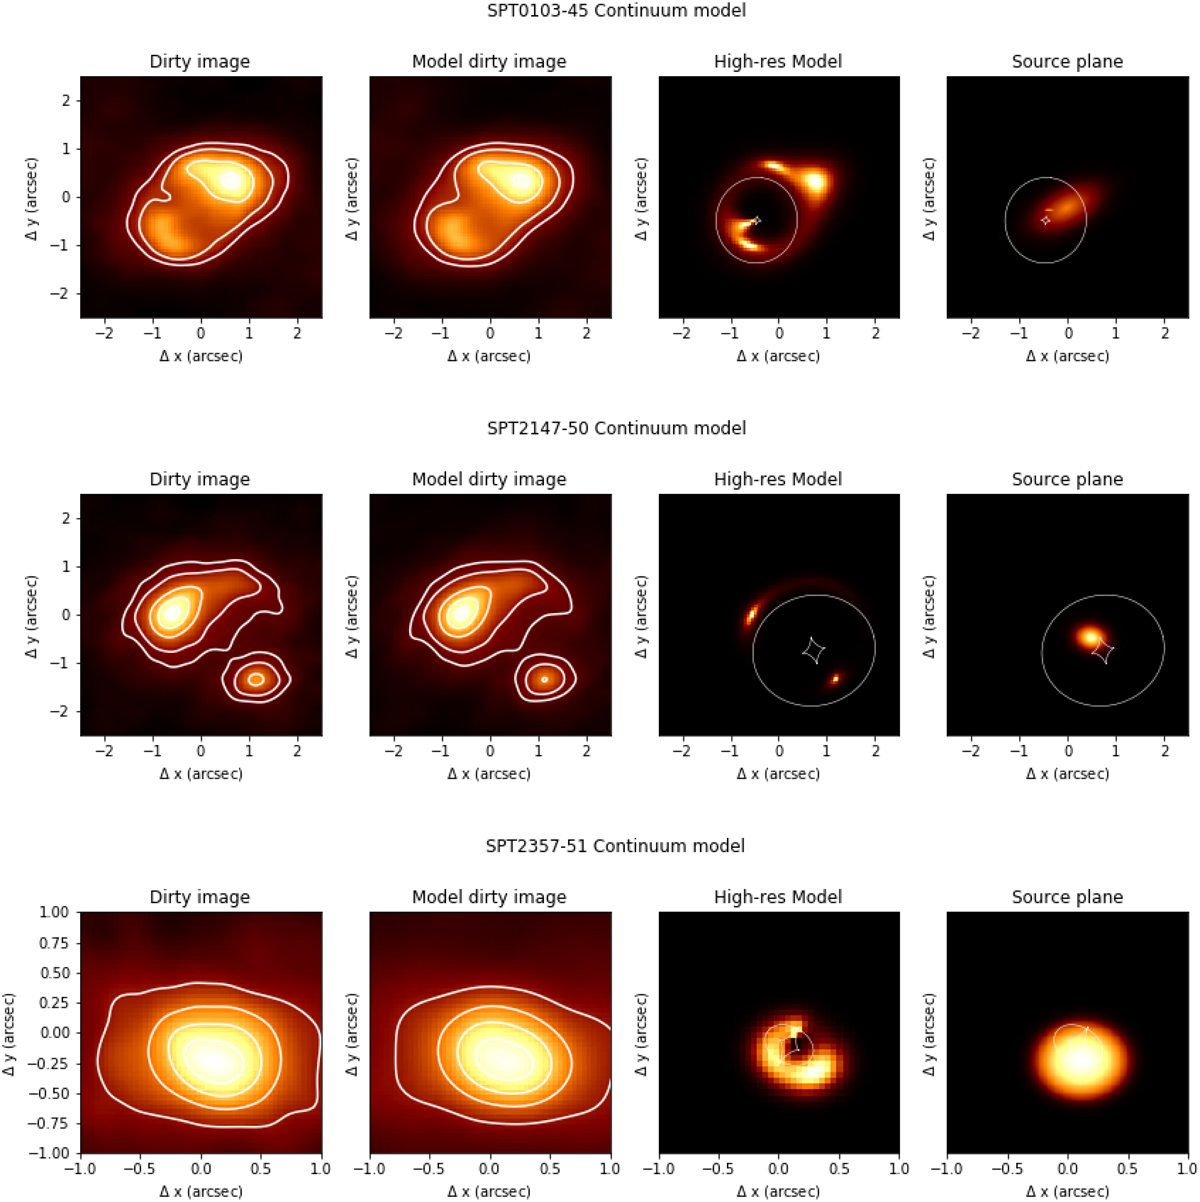
Fig. 10.
Download original image
Modelling the continuum emission of our sources. SPT0103−45 is in the first row, SPT2147−50 in the second row and SPT2357−51 in the third row. For every source, the first panel (from the left) is the dirty image of the continuum, the second is the dirty image produced by best-fit model, third is a ‘high-resolution’ image-plane model, i.e. not sampled by the uv coverage of the data and the fourth panel is the best-fit model in the source plane. In the third and fourth panels, the lensing caustics are shown in white.
Current usage metrics show cumulative count of Article Views (full-text article views including HTML views, PDF and ePub downloads, according to the available data) and Abstracts Views on Vision4Press platform.
Data correspond to usage on the plateform after 2015. The current usage metrics is available 48-96 hours after online publication and is updated daily on week days.
Initial download of the metrics may take a while.