Fig. 1.
Download original image
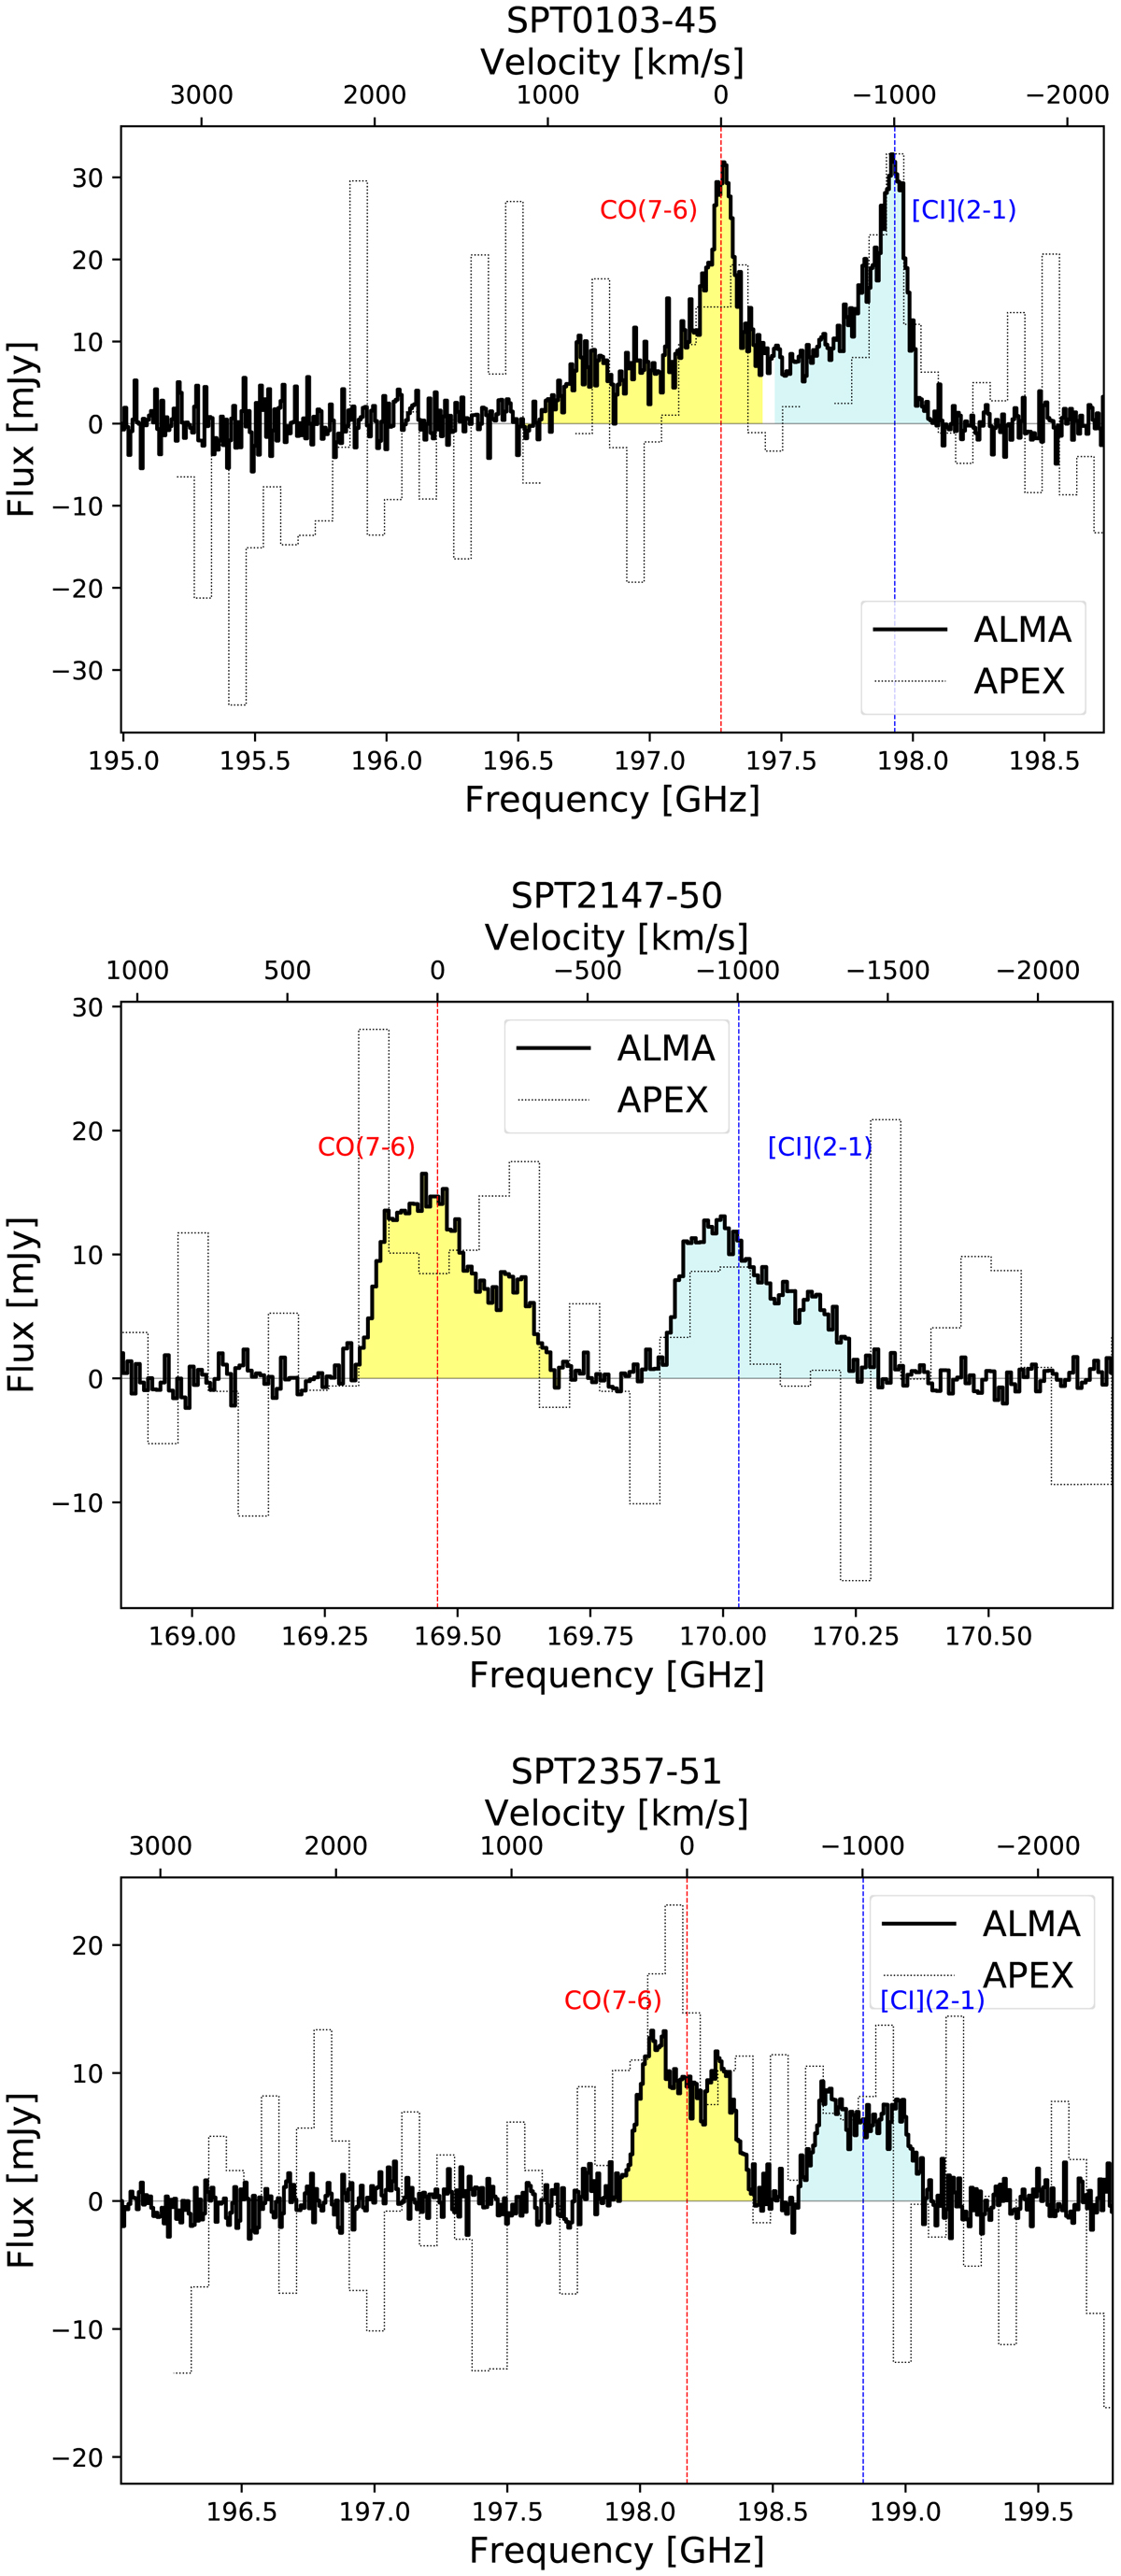
Integrated spectra of SPT0103−45 (top panel), SPT2147−50 (middle panel) and SPT2357−51 (lower panel). The black solid line is the spectrum extracted from the ALMA observations (see Sect. 2.3). The light grey line is the APEX/SEPIA spectrum (see Sect. 2.1). Red and blue vertical dashed lines indicate the position of CO(7−6) and [CI](2−1) lines, respectively, at the reference redshift of the source. The yellow and cyan shaded areas show the integration windows used to compute integrated fluxes of the CO(7−6) and [CI](2−1) lines, respectively (see Sect. 4.3). The zero-velocity corresponds to the observed frequency of CO(7−6) line for each of the sources.
Current usage metrics show cumulative count of Article Views (full-text article views including HTML views, PDF and ePub downloads, according to the available data) and Abstracts Views on Vision4Press platform.
Data correspond to usage on the plateform after 2015. The current usage metrics is available 48-96 hours after online publication and is updated daily on week days.
Initial download of the metrics may take a while.