Free Access
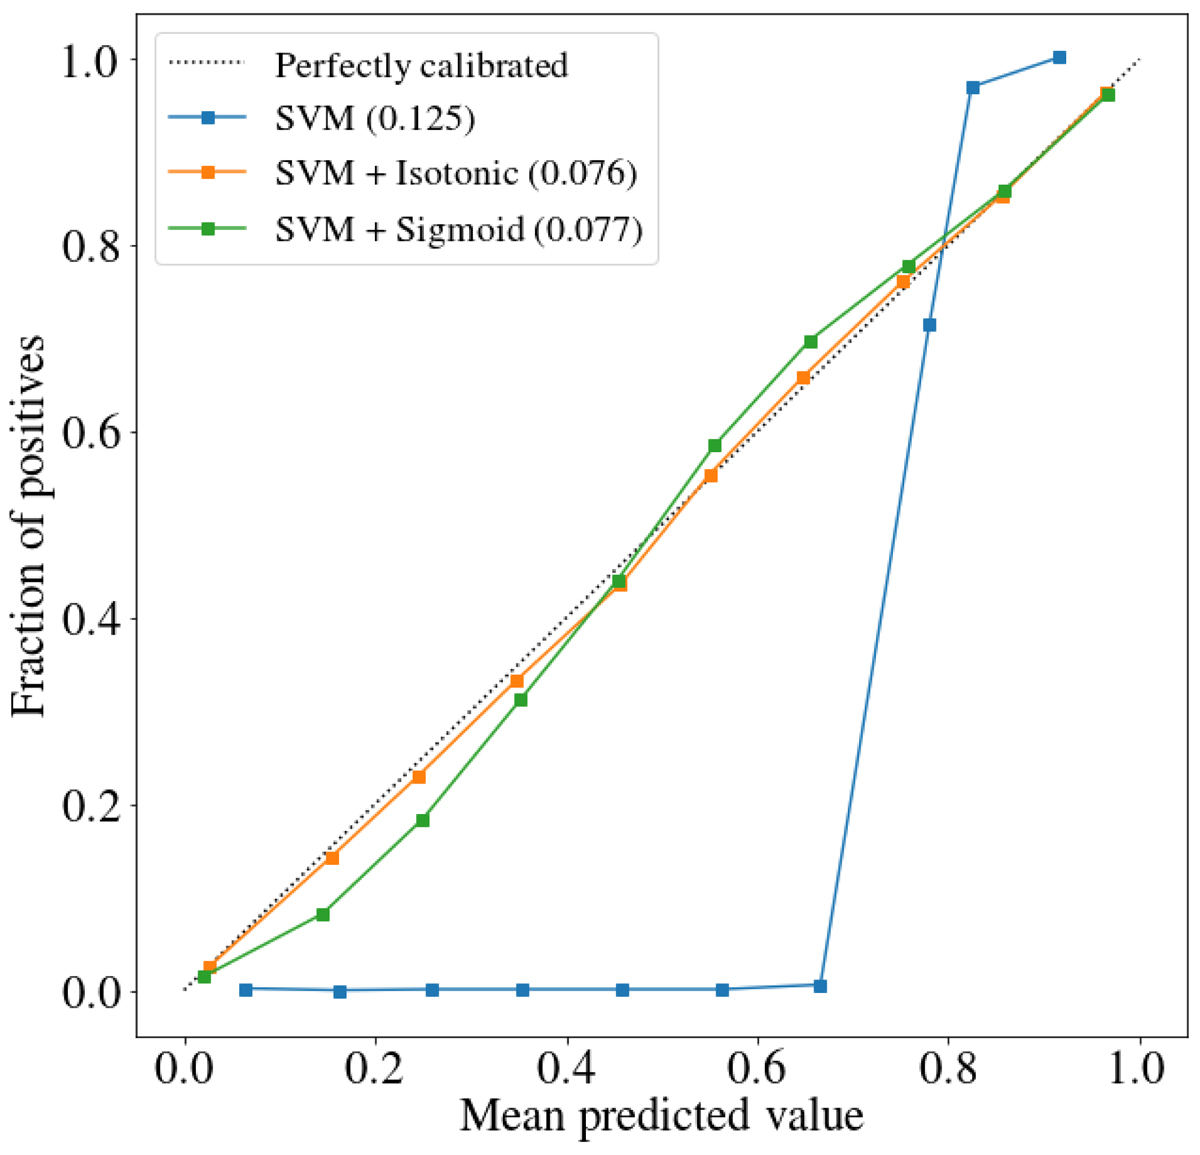
Fig. 2.
Download original image
Reliability curves of the predicted values for the three different kernels used in the classification. The reliability curves compare the mean predicted value of a random subsample to the fraction of actual positives in the sample. The numbers between parentheses refer to the Brier score (see Sect. 3.3).
Current usage metrics show cumulative count of Article Views (full-text article views including HTML views, PDF and ePub downloads, according to the available data) and Abstracts Views on Vision4Press platform.
Data correspond to usage on the plateform after 2015. The current usage metrics is available 48-96 hours after online publication and is updated daily on week days.
Initial download of the metrics may take a while.