Fig. B.2.
Download original image
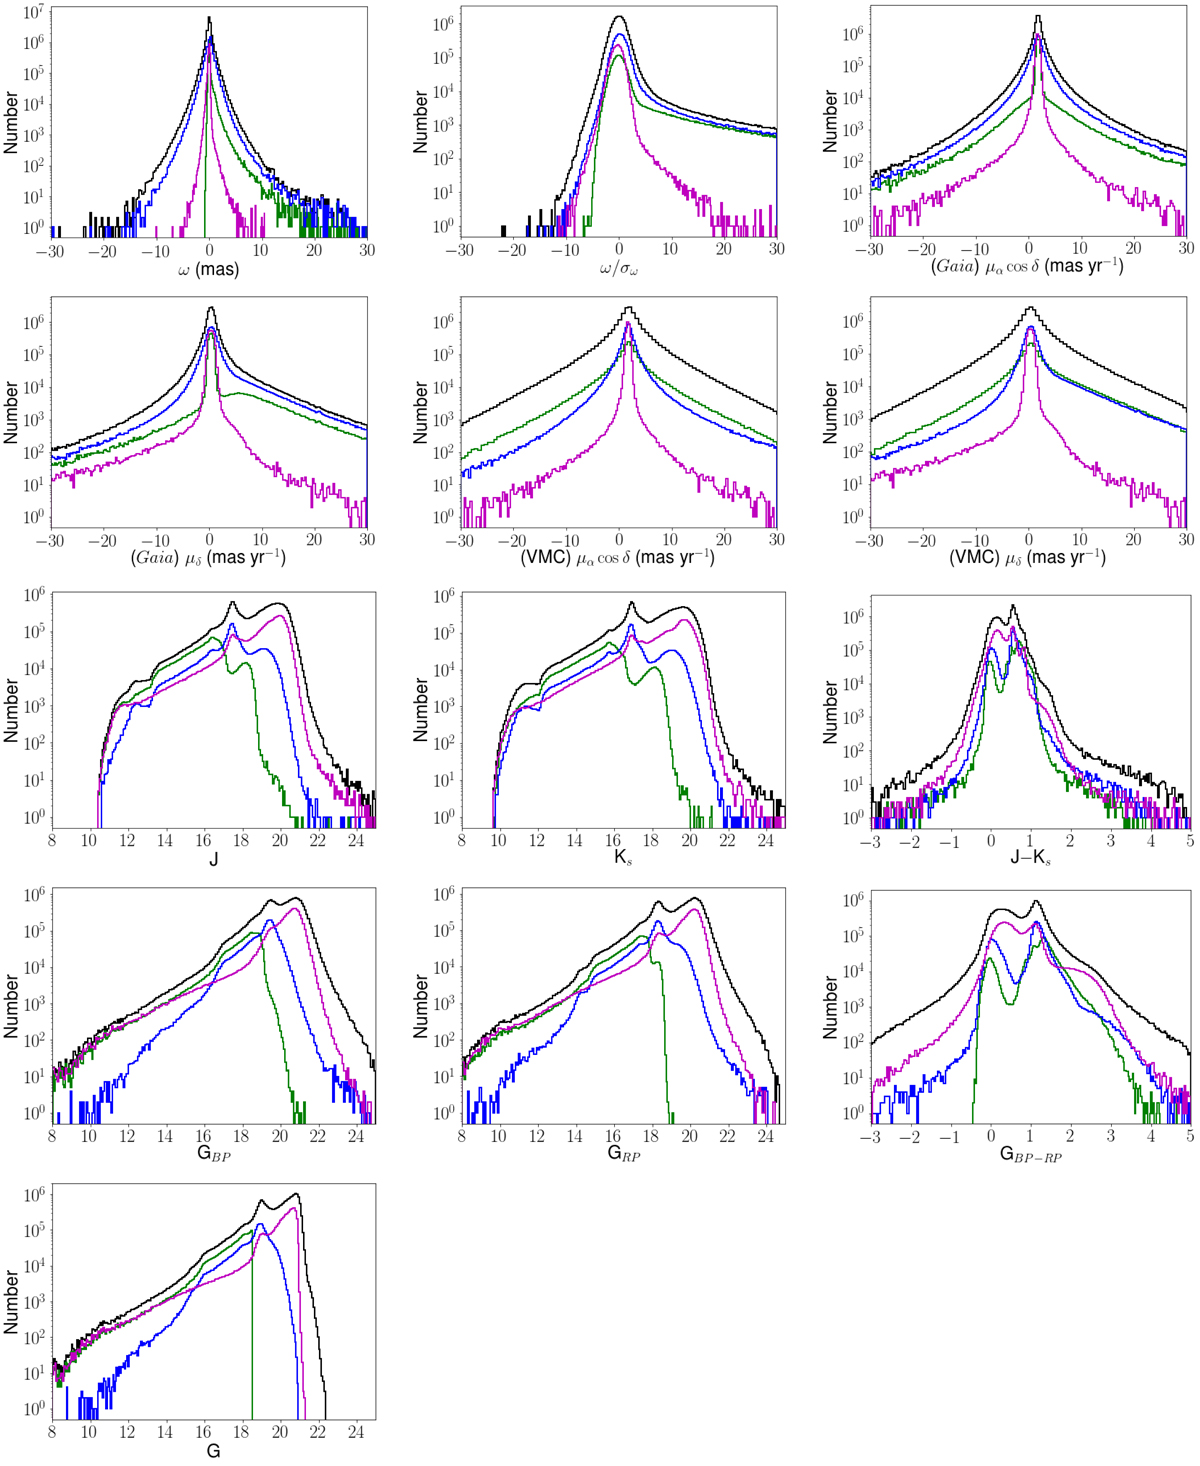
Histograms of the distribution of the number of stars with respect to the 13 parameters used by the machine learning algorithm. The training sample is shown in green, whereas the full catalogue is shown in black. Magenta and blue lines refer instead to the distributions of LMC and MW stars, respectively, as classified by the algorithm.
Current usage metrics show cumulative count of Article Views (full-text article views including HTML views, PDF and ePub downloads, according to the available data) and Abstracts Views on Vision4Press platform.
Data correspond to usage on the plateform after 2015. The current usage metrics is available 48-96 hours after online publication and is updated daily on week days.
Initial download of the metrics may take a while.