Free Access
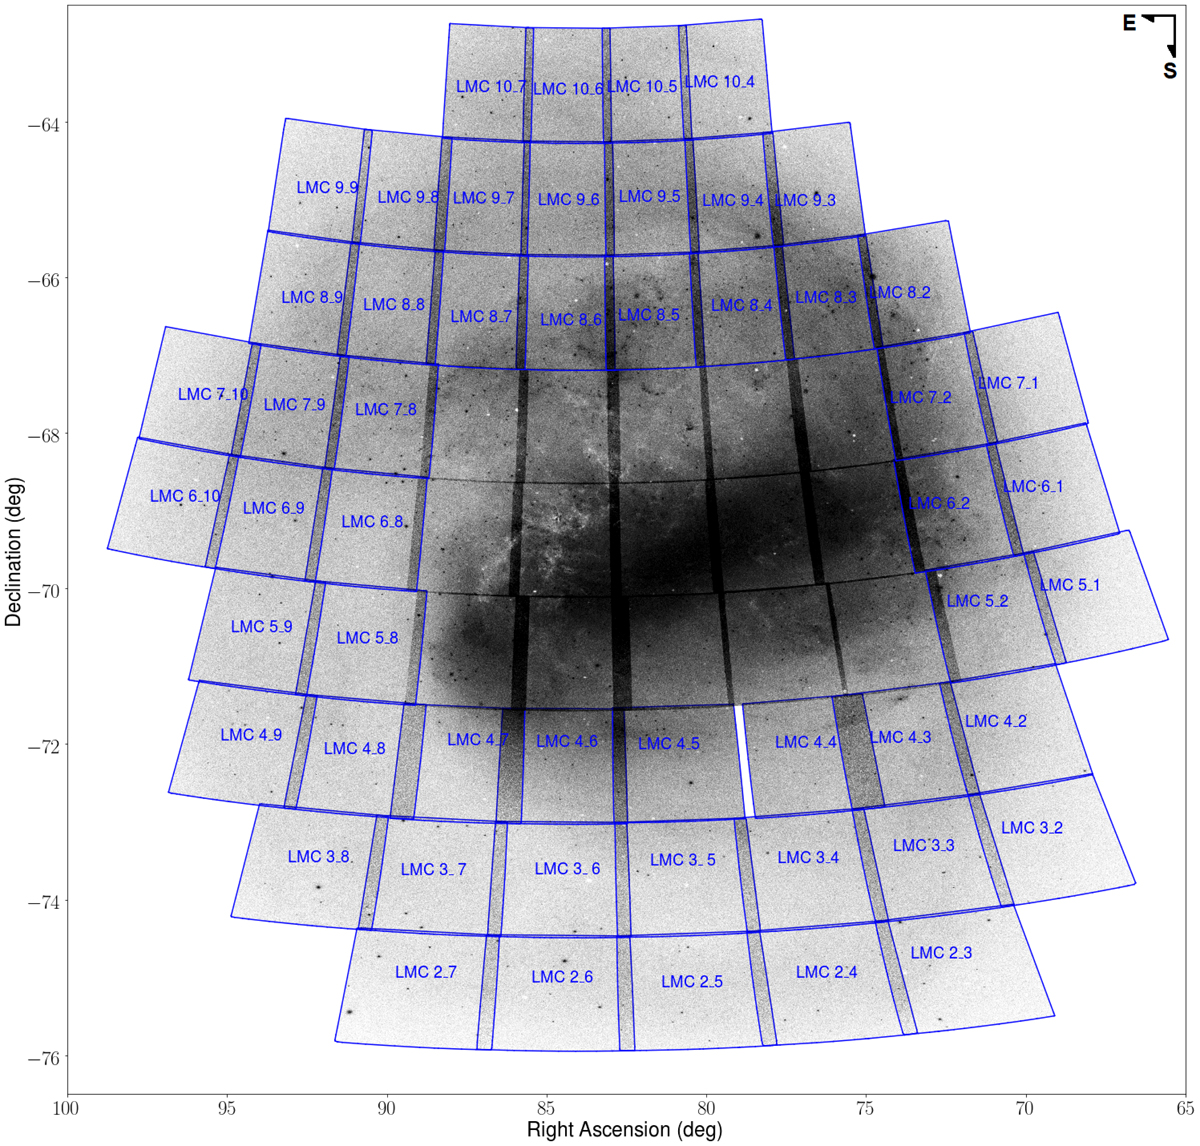
Fig. 1.
Download original image
Distribution of VMC tiles across the LMC. The tiles used in this study are those in the outer regions of the galaxy and are indicated by their IDs. The image in the background shows the distribution of all VMC sources.
Current usage metrics show cumulative count of Article Views (full-text article views including HTML views, PDF and ePub downloads, according to the available data) and Abstracts Views on Vision4Press platform.
Data correspond to usage on the plateform after 2015. The current usage metrics is available 48-96 hours after online publication and is updated daily on week days.
Initial download of the metrics may take a while.