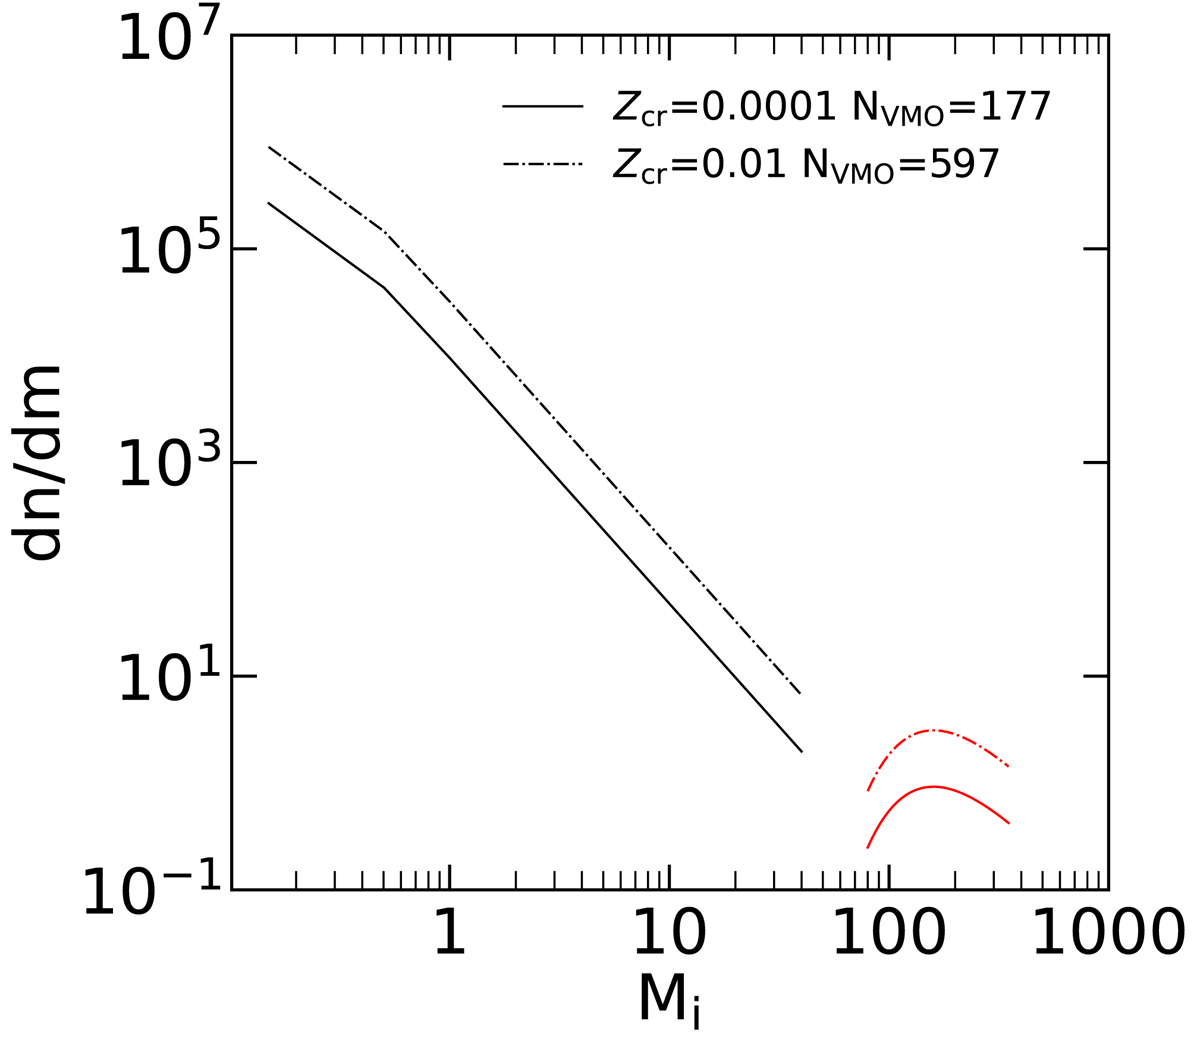
Fig. 3.
Download original image
Adopted IMF for chemical evolution of models M4ω4 (solid red line) and M5ω4 (dot-dashed red line). The VMO IMF distributions are given by Eq. (4) with Mchar = 200 M⊙ and normalised to the cumulative mass reached at the corresponding Zcr. For comparison, the IMFs of the post-VMO burst phases, with the same mass normalisation, are also shown (black lines). The expected number of VMOs is shown in the label and in Table 2.
Current usage metrics show cumulative count of Article Views (full-text article views including HTML views, PDF and ePub downloads, according to the available data) and Abstracts Views on Vision4Press platform.
Data correspond to usage on the plateform after 2015. The current usage metrics is available 48-96 hours after online publication and is updated daily on week days.
Initial download of the metrics may take a while.