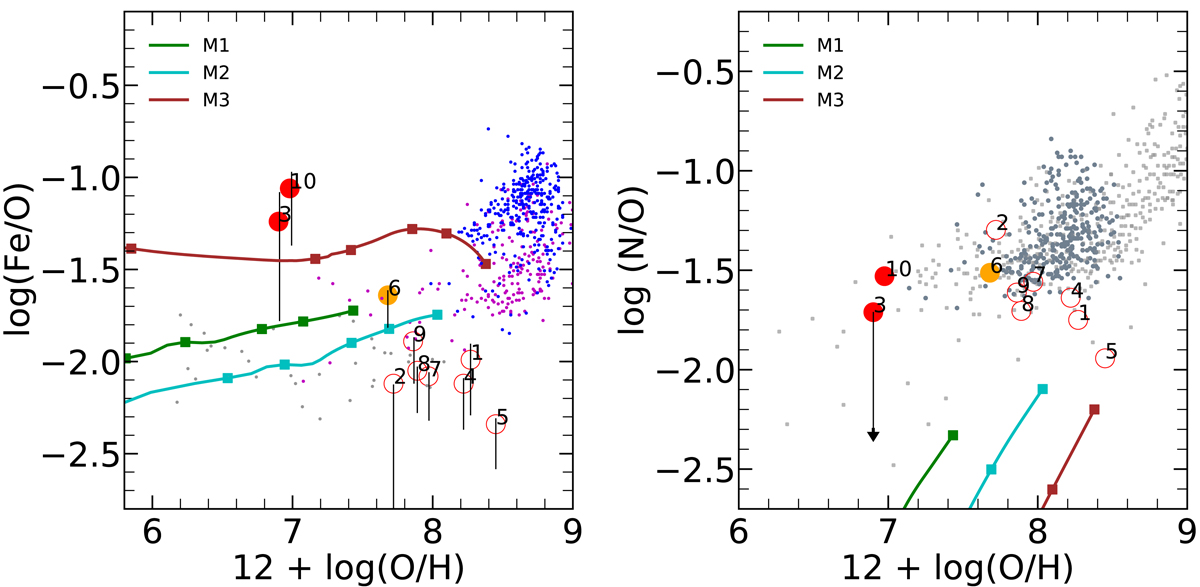
Fig. 2.
Download original image
Fe/O ratio (left panel) and N/O ratio (right panel) as a function of the metallicity, 12+log(O/H). EMPGs from Kojima et al. (2021) are shown as numbered circles from 1 to 9. Object 10 is the EMPG from Izotov et al. (2018). The lowest metallicity EMPGs are are highlighted as filled circles (red for objects 3 and 10, and orange for the intermediate object 6). In the left panel, blue and magenta dots represent, respectively, thin and thick disc stars from Bensby et al. (2014), and grey dots represent low-metallicity stars from Cayrel et al. (2004). In the right panel, light grey dots correspond to local galaxies from Izotov et al. (2006), and dark grey dots are assembled from Pettini et al. (2002) and Pettini et al. (2008), which are for extragalactic H II regions and high-redshift DLA systems. Solid line with squares show the evolution of the abundance ratios for the models of Table 1. The six squares mark, from left to right, model ages at 5, 20, 30 , 60, 100, and 200 Myr, respectively, the latter being larger than the estimated upper limit by Kojima et al. (2021). See text for details.
Current usage metrics show cumulative count of Article Views (full-text article views including HTML views, PDF and ePub downloads, according to the available data) and Abstracts Views on Vision4Press platform.
Data correspond to usage on the plateform after 2015. The current usage metrics is available 48-96 hours after online publication and is updated daily on week days.
Initial download of the metrics may take a while.