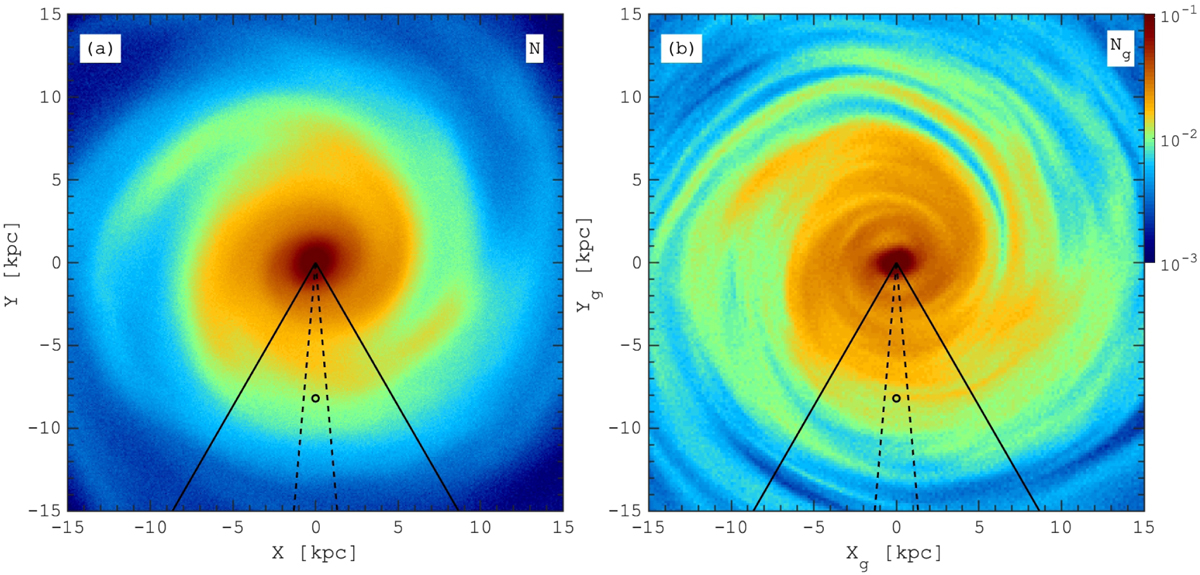
Fig. 1.
Download original image
Stellar density maps of the N-body model in (X,Y) (left) and (Xg,Yg) coordinates (right, see Eq. (1) for the guiding coordinates transformation). The solid lines highlight a region of 60° in azimuth, comparable to the coverage in the MW of the Gaia RVS sample. The dashed lines limit the region we adopt in the analysis of R−vϕ-ridges, and an SNd-like region (0.2 kpc, solid line circle) is placed at Y = −8.0 kpc.
Current usage metrics show cumulative count of Article Views (full-text article views including HTML views, PDF and ePub downloads, according to the available data) and Abstracts Views on Vision4Press platform.
Data correspond to usage on the plateform after 2015. The current usage metrics is available 48-96 hours after online publication and is updated daily on week days.
Initial download of the metrics may take a while.