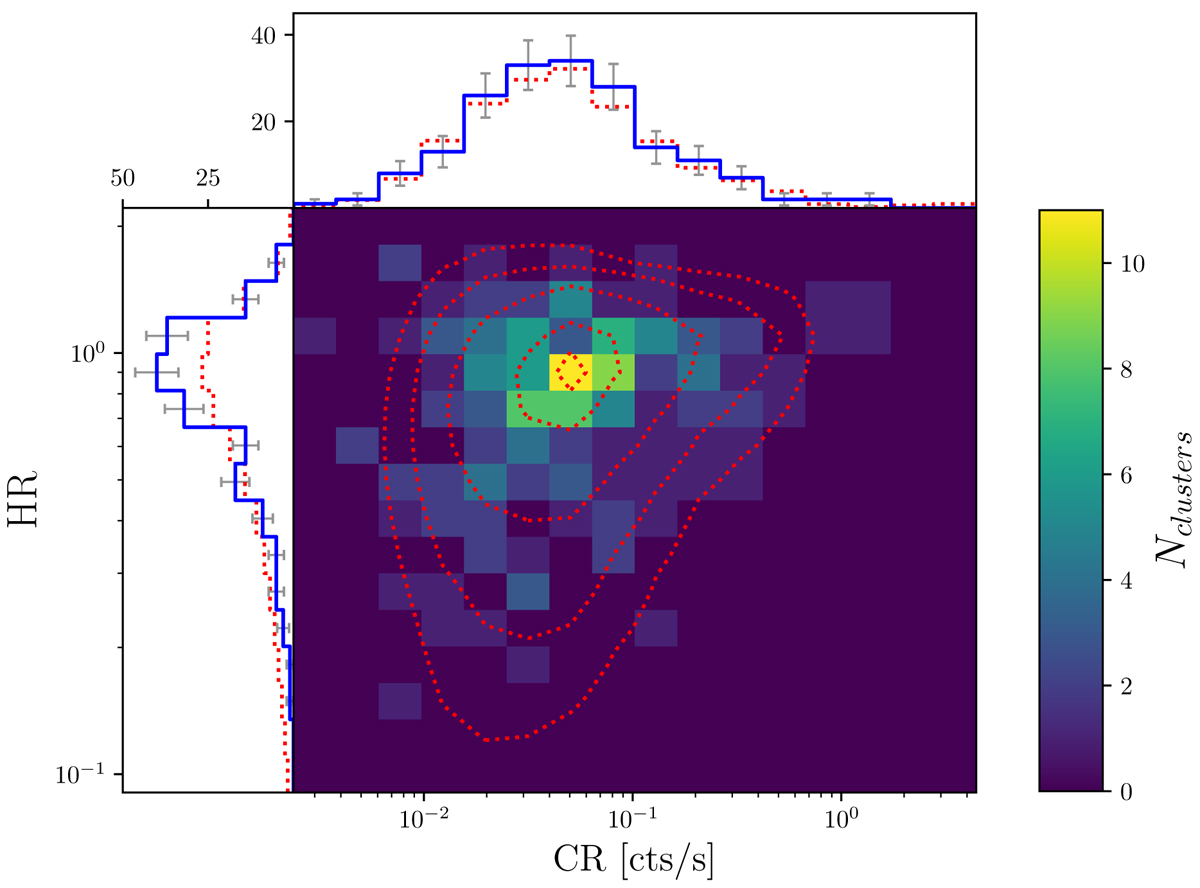
Fig. B.1.
Download original image
X-ray observable diagram of the XXL C1 sample, integrated over the redshift range [0.05-1] used in this study, together with the 1D CR, HR distributions in blue. In red, the theoretical diagram predicted by our ΛCDM best-fit parameters given in section 4.1. We can see where the CR–HR space is not dominated by the shot noise (![]() objects); we obtain, on average, that
objects); we obtain, on average, that ![]() is smaller than
is smaller than ![]() . Error bars only account for shot noise.
. Error bars only account for shot noise.
Current usage metrics show cumulative count of Article Views (full-text article views including HTML views, PDF and ePub downloads, according to the available data) and Abstracts Views on Vision4Press platform.
Data correspond to usage on the plateform after 2015. The current usage metrics is available 48-96 hours after online publication and is updated daily on week days.
Initial download of the metrics may take a while.