Fig. A.1.
Download original image
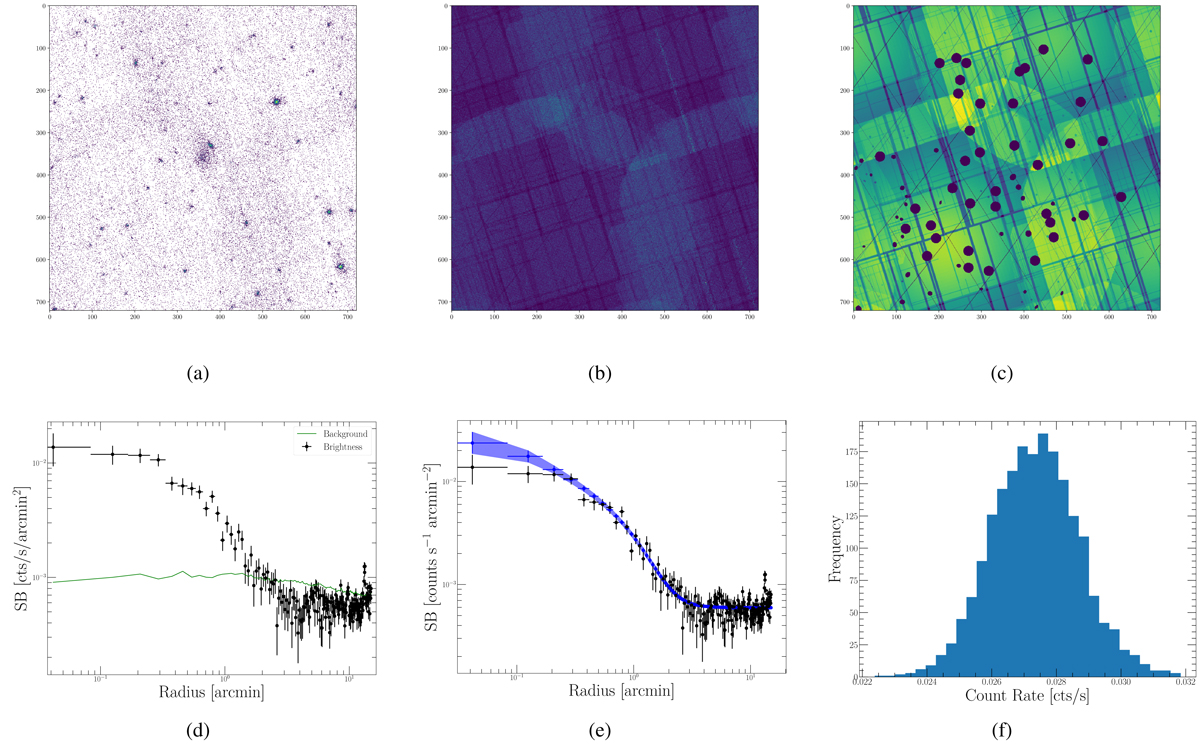
Example of cluster count-rate measurement with the pyproffit method. The displayed cluster is XLSSC 093 at a redshift of 0.429. (a) X-ray mosaic around the cluster; the image is 30 arcmin aside. (b) Particle background map. (c) Combined exposure map along with the masks hiding the neighbouring sources. (d) Extracted cluster profile (black crosses); the green line displays the particle background level extracted from map (b): this component is already subtracted from the displayed profile. (e) Overlaid on the extracted profile, the reconstructed (PSF-deconvolved) profile is shown in blue along with the 1-σ estimated uncertainty. (f) Count-rate posterior distribution (MOS1 normalised) of the reconstructed profile.
Current usage metrics show cumulative count of Article Views (full-text article views including HTML views, PDF and ePub downloads, according to the available data) and Abstracts Views on Vision4Press platform.
Data correspond to usage on the plateform after 2015. The current usage metrics is available 48-96 hours after online publication and is updated daily on week days.
Initial download of the metrics may take a while.