Fig. 3
Download original image
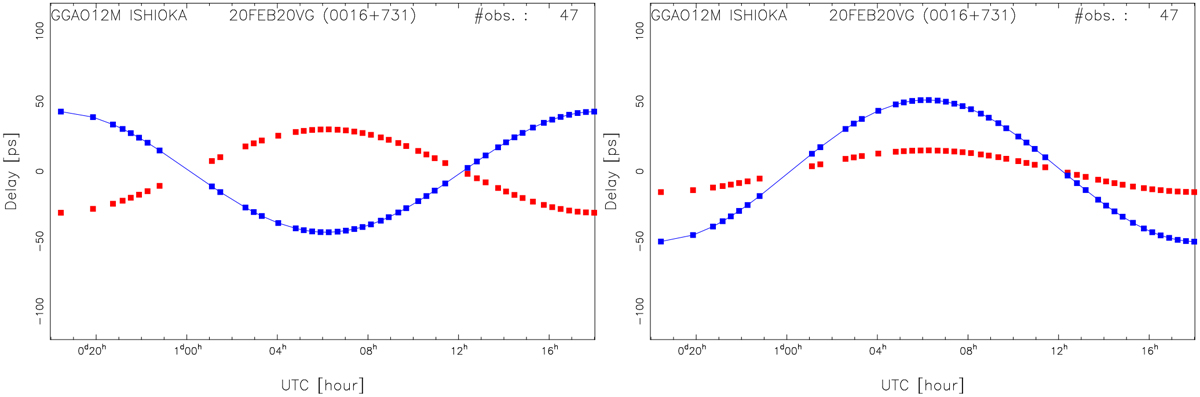
Simulation of broadband group delays of the baseline GGAO12M–ISHIOKA by assuming the position of source 0016+731 in band B to be offset by +0.2mas in declination (left) and the position in band D to be offset by +0.1 mas in declination (right). In these two cases, the reference position is selected to be the positions in the other three bands. The red dots, corresponding to the 47 observations for the source on the baseline in session VO0051, show the delay offsets induced by the applied position shifts, in band B for the left panel and in band D for the right panel. The blue dots are the broadband group delays based on the simulation for the 47 observations. The models based on these position estimates are shown as blue curves.
Current usage metrics show cumulative count of Article Views (full-text article views including HTML views, PDF and ePub downloads, according to the available data) and Abstracts Views on Vision4Press platform.
Data correspond to usage on the plateform after 2015. The current usage metrics is available 48-96 hours after online publication and is updated daily on week days.
Initial download of the metrics may take a while.