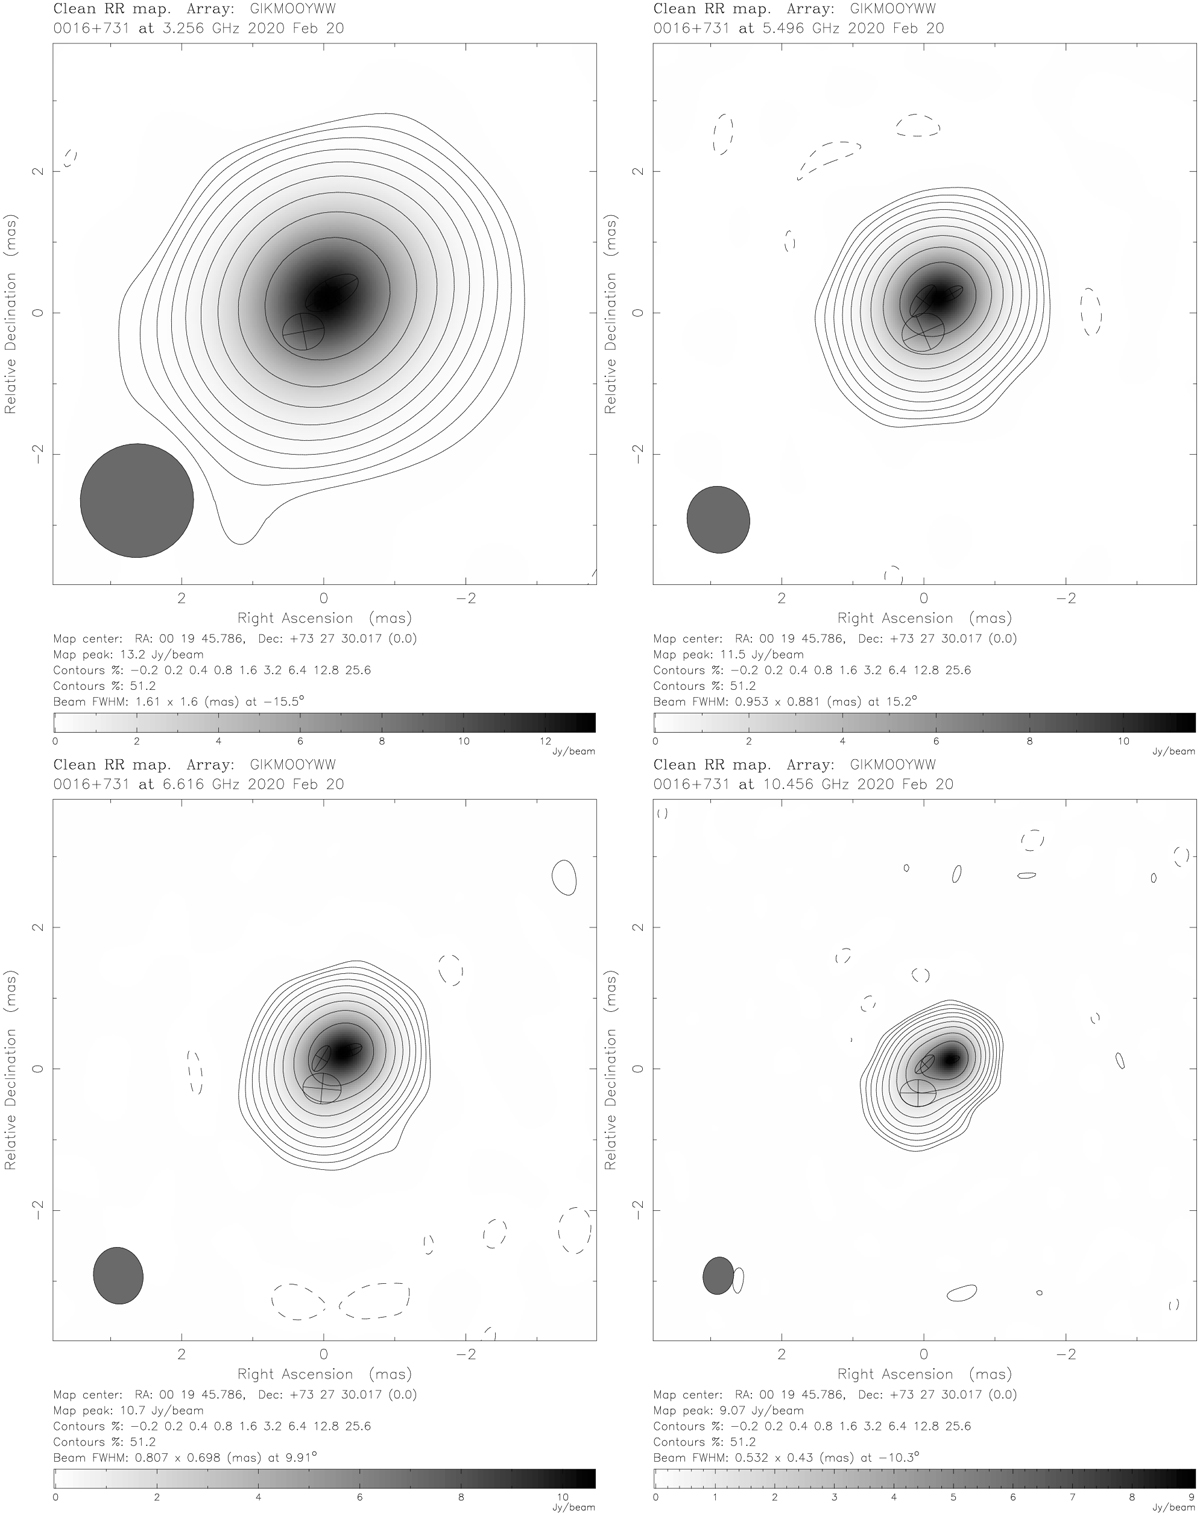
Fig. 2
Download original image
Images of source 0016+731 from VGOS session VO0051 (February 20, 2020) at 3.3 GHz (upper left), 5.5 GHz (upper right), 6.6 GHz (bottom left), and 10.5 GHz (bottom right). The ellipses indicate the Gaussian components, the parameters of which are reported in Table 1. Overlay positive contours are shown at nine levels of peak percentage, starting from 0.2% and increasing by a factor of 2, while the negative contour, indicated as dash lines, has a peak percentage of – 0.2%. These images are constructed from the VGOS observations, which are calibrated based on the images derived from closure phases and closure amplitudes (Xu et al. 2021d). Therefore, the pixel flux densities have arbitrary units. The beam size is shown as a filled ellipse in the bottom-left corner of each plot.
Current usage metrics show cumulative count of Article Views (full-text article views including HTML views, PDF and ePub downloads, according to the available data) and Abstracts Views on Vision4Press platform.
Data correspond to usage on the plateform after 2015. The current usage metrics is available 48-96 hours after online publication and is updated daily on week days.
Initial download of the metrics may take a while.