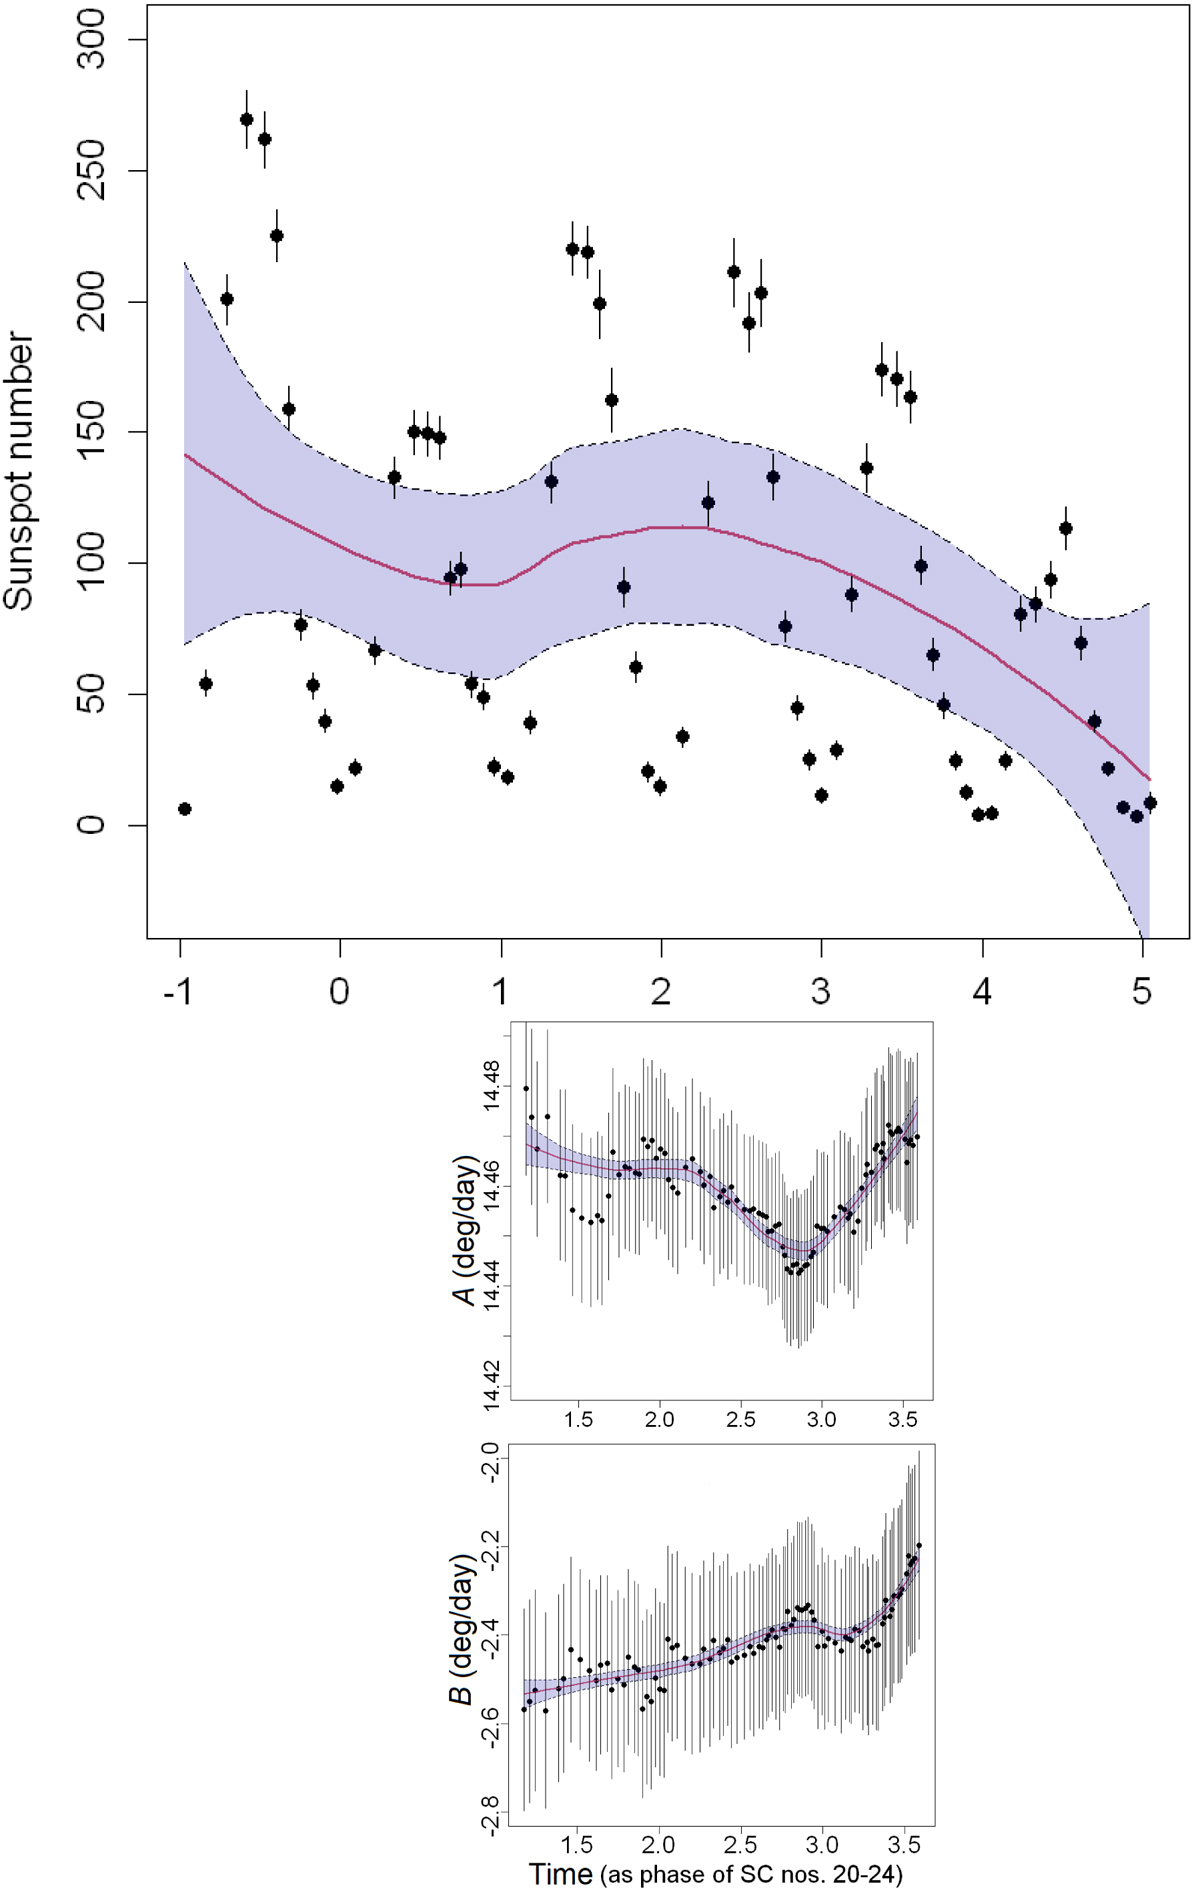
Fig. 5.
Download original image
Long-term changes in the KSO differential rotation parameters. In the top panel SILSO sunspot group numbers are shown in phase space, where the whole phases mark cycle minima. Phase range 0–1 belongs to SC 20, phase range 1–2 to SC 21, etc. Phase 0 indicates the beginning of the analysed time period (1964). A LOESS non-parametric fit was applied to the original data using span = 0.65, and a smoothing in a window covering 65% of data points (red curve) in order to obtain general trend. The same was performed for parameters A and B (middle and bottom panel), but with moving-average values in order to remove in-cycle variations, with a LOESS smoothing of the same span as before. Moving averages were calculated over two solar cycles for each of the data points, which corresponds to the periodicity of parameter A.
Current usage metrics show cumulative count of Article Views (full-text article views including HTML views, PDF and ePub downloads, according to the available data) and Abstracts Views on Vision4Press platform.
Data correspond to usage on the plateform after 2015. The current usage metrics is available 48-96 hours after online publication and is updated daily on week days.
Initial download of the metrics may take a while.