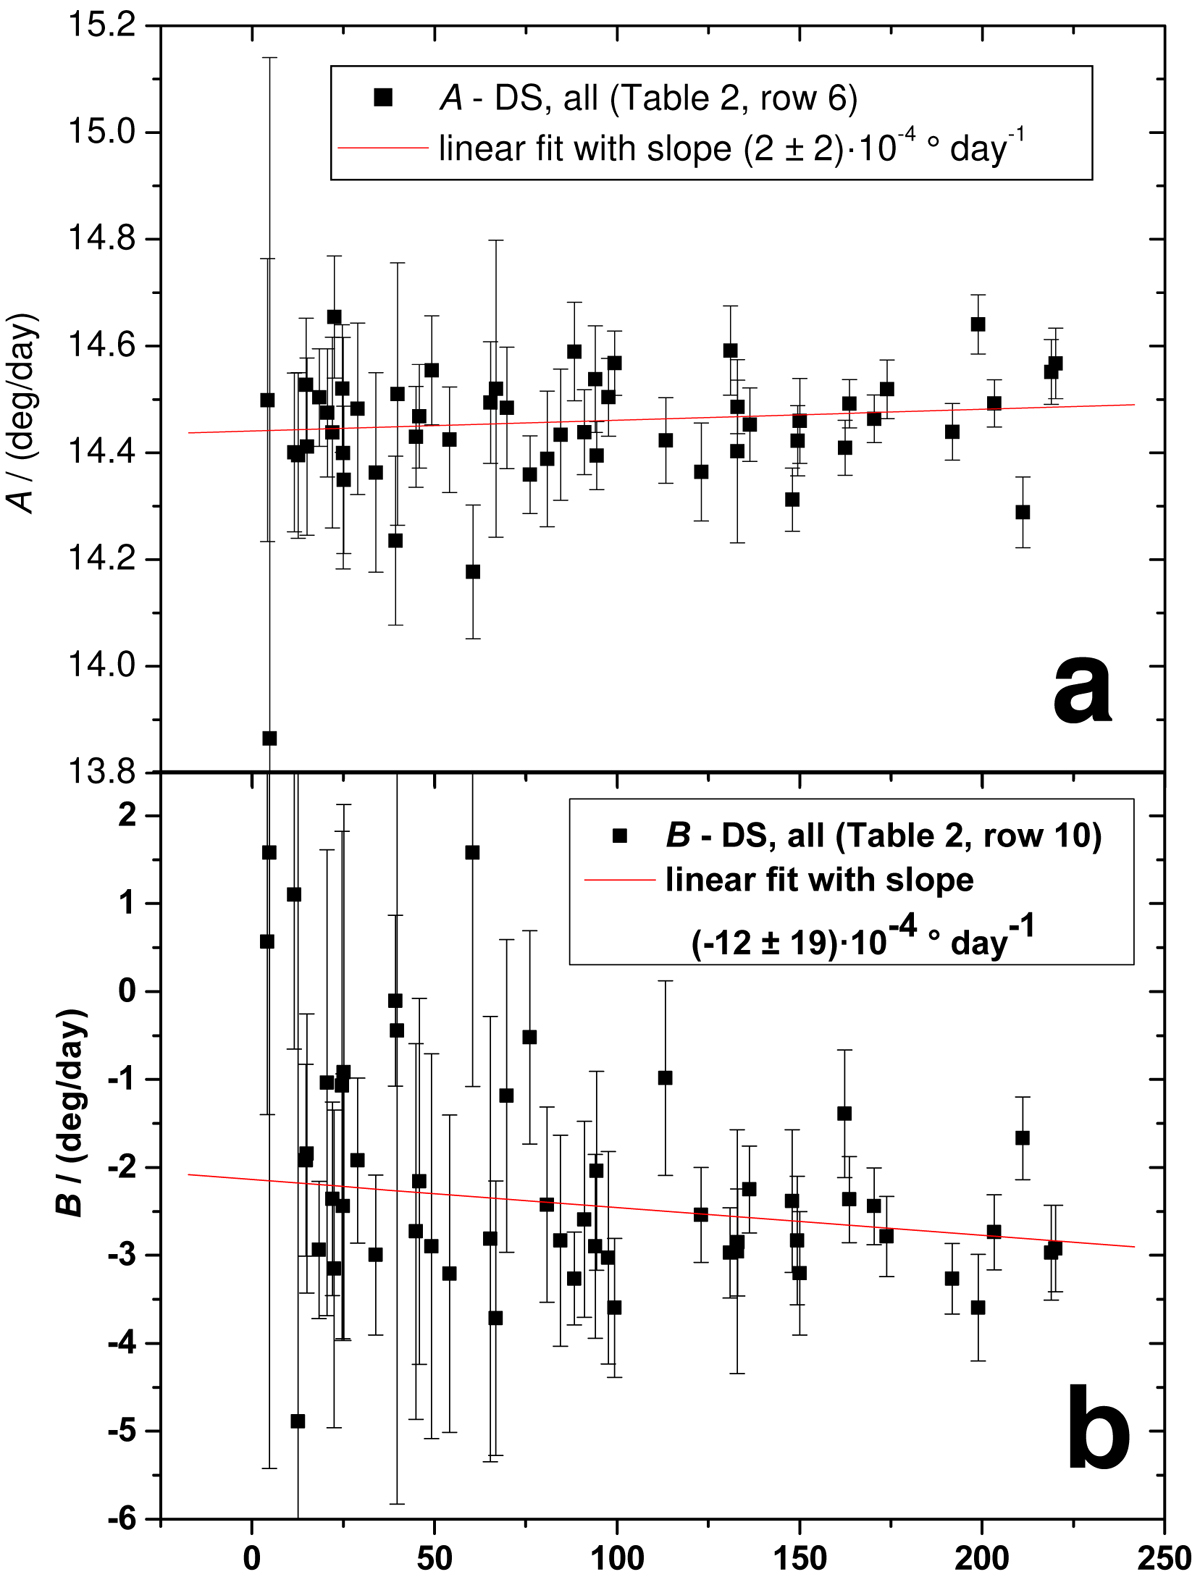
Fig. 4.
Download original image
Dependence of annual KSO DR parameters A and B and the WDC-SILSO relative sunspot number as an indicator of solar activity. Straight lines represent least-squares fits through the set of data points derived by the DS method for individual years. Parts a and b cover all KSO measurements 1964–2016. Statistical results for each least-squares fit are available in Table 2, rows 6 and 10.
Current usage metrics show cumulative count of Article Views (full-text article views including HTML views, PDF and ePub downloads, according to the available data) and Abstracts Views on Vision4Press platform.
Data correspond to usage on the plateform after 2015. The current usage metrics is available 48-96 hours after online publication and is updated daily on week days.
Initial download of the metrics may take a while.