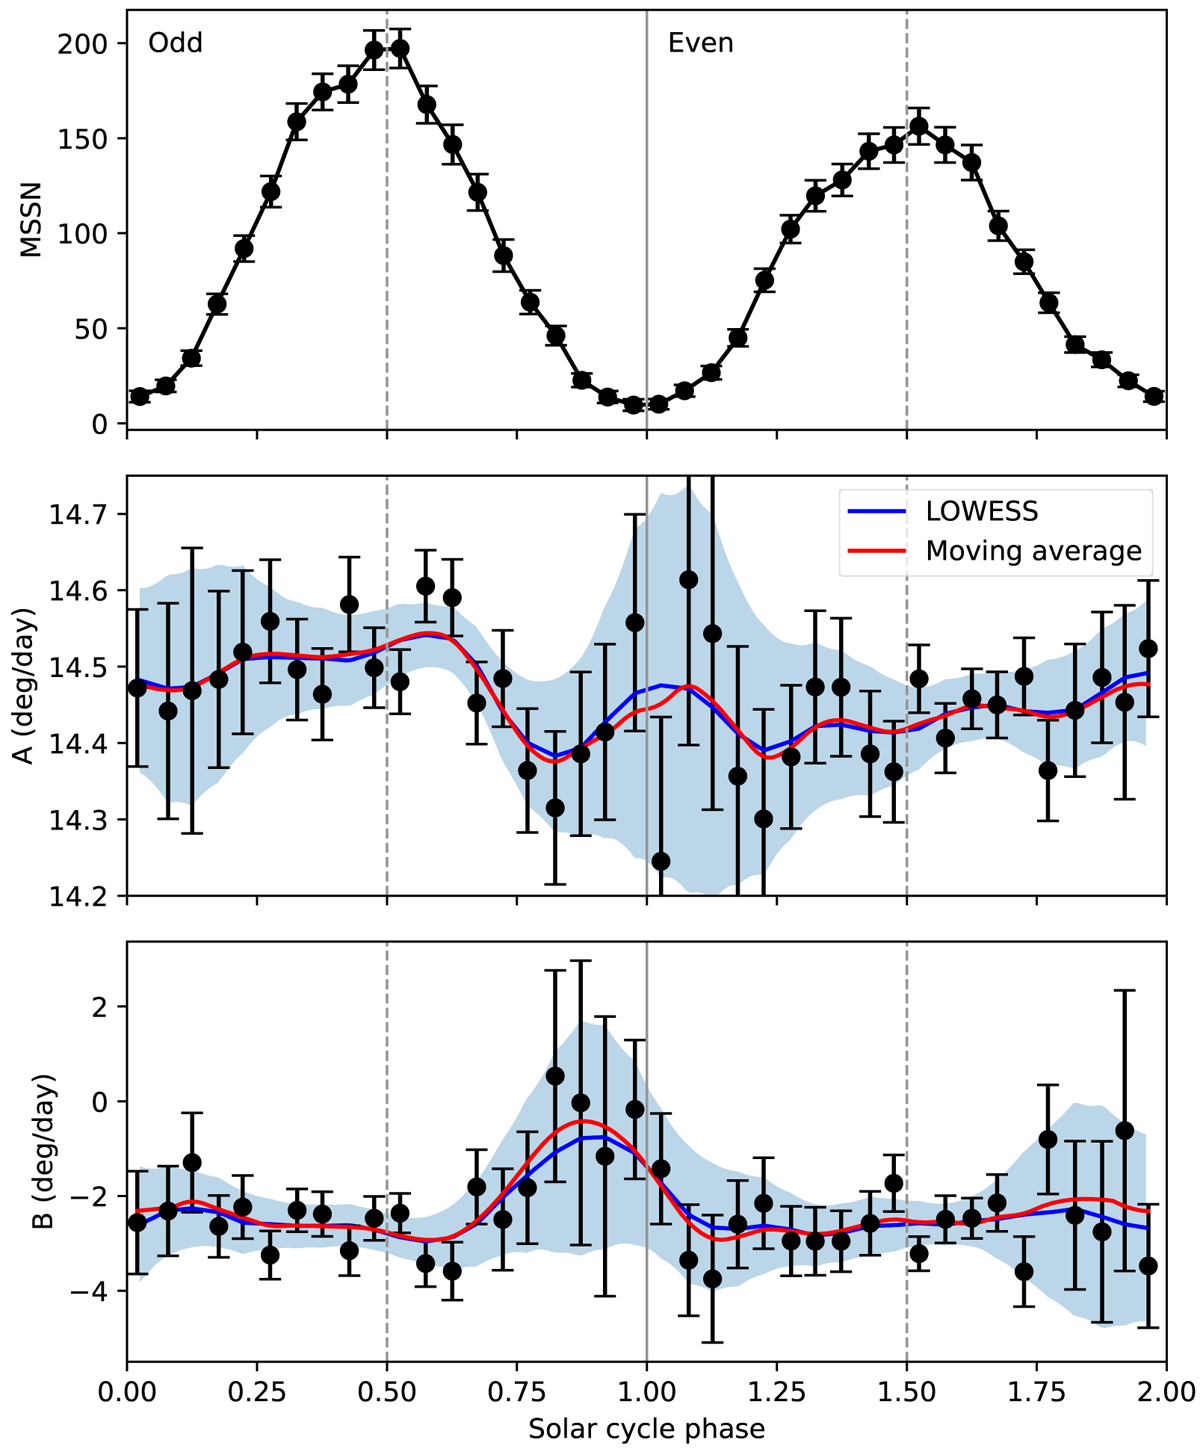
Fig. 3.
Download original image
Solar cycle phase diagram in the single odd–even space for parameter A (middle panel) and parameter B (bottom panel). For 40 bins of the same size (0.05 phase each), the DR parameters were calculated and are shown as black dots with the corresponding standard errors. A moving average of these values was calculated (red curve), using a window size of 3 bins. Additionally, LOWESS smoothing was applied to the original bins using a data fraction of 1/6 (blue curve). In the top panel, the SILSO 13-month smoothed monthly total sunspot number is shown. Phases in the range 0–1 represent odd SCs 21 and 23, and phases in the range 1–2 show even SCs 20, 22, and 24. Whole phases mark cycle minima (vertical solid grey line), and cycle maxima are located at 0.5 and 1.5 phase values (vertical dashed grey lines). Bootstrapping was applied to determine the uncertainty (blue areas).
Current usage metrics show cumulative count of Article Views (full-text article views including HTML views, PDF and ePub downloads, according to the available data) and Abstracts Views on Vision4Press platform.
Data correspond to usage on the plateform after 2015. The current usage metrics is available 48-96 hours after online publication and is updated daily on week days.
Initial download of the metrics may take a while.