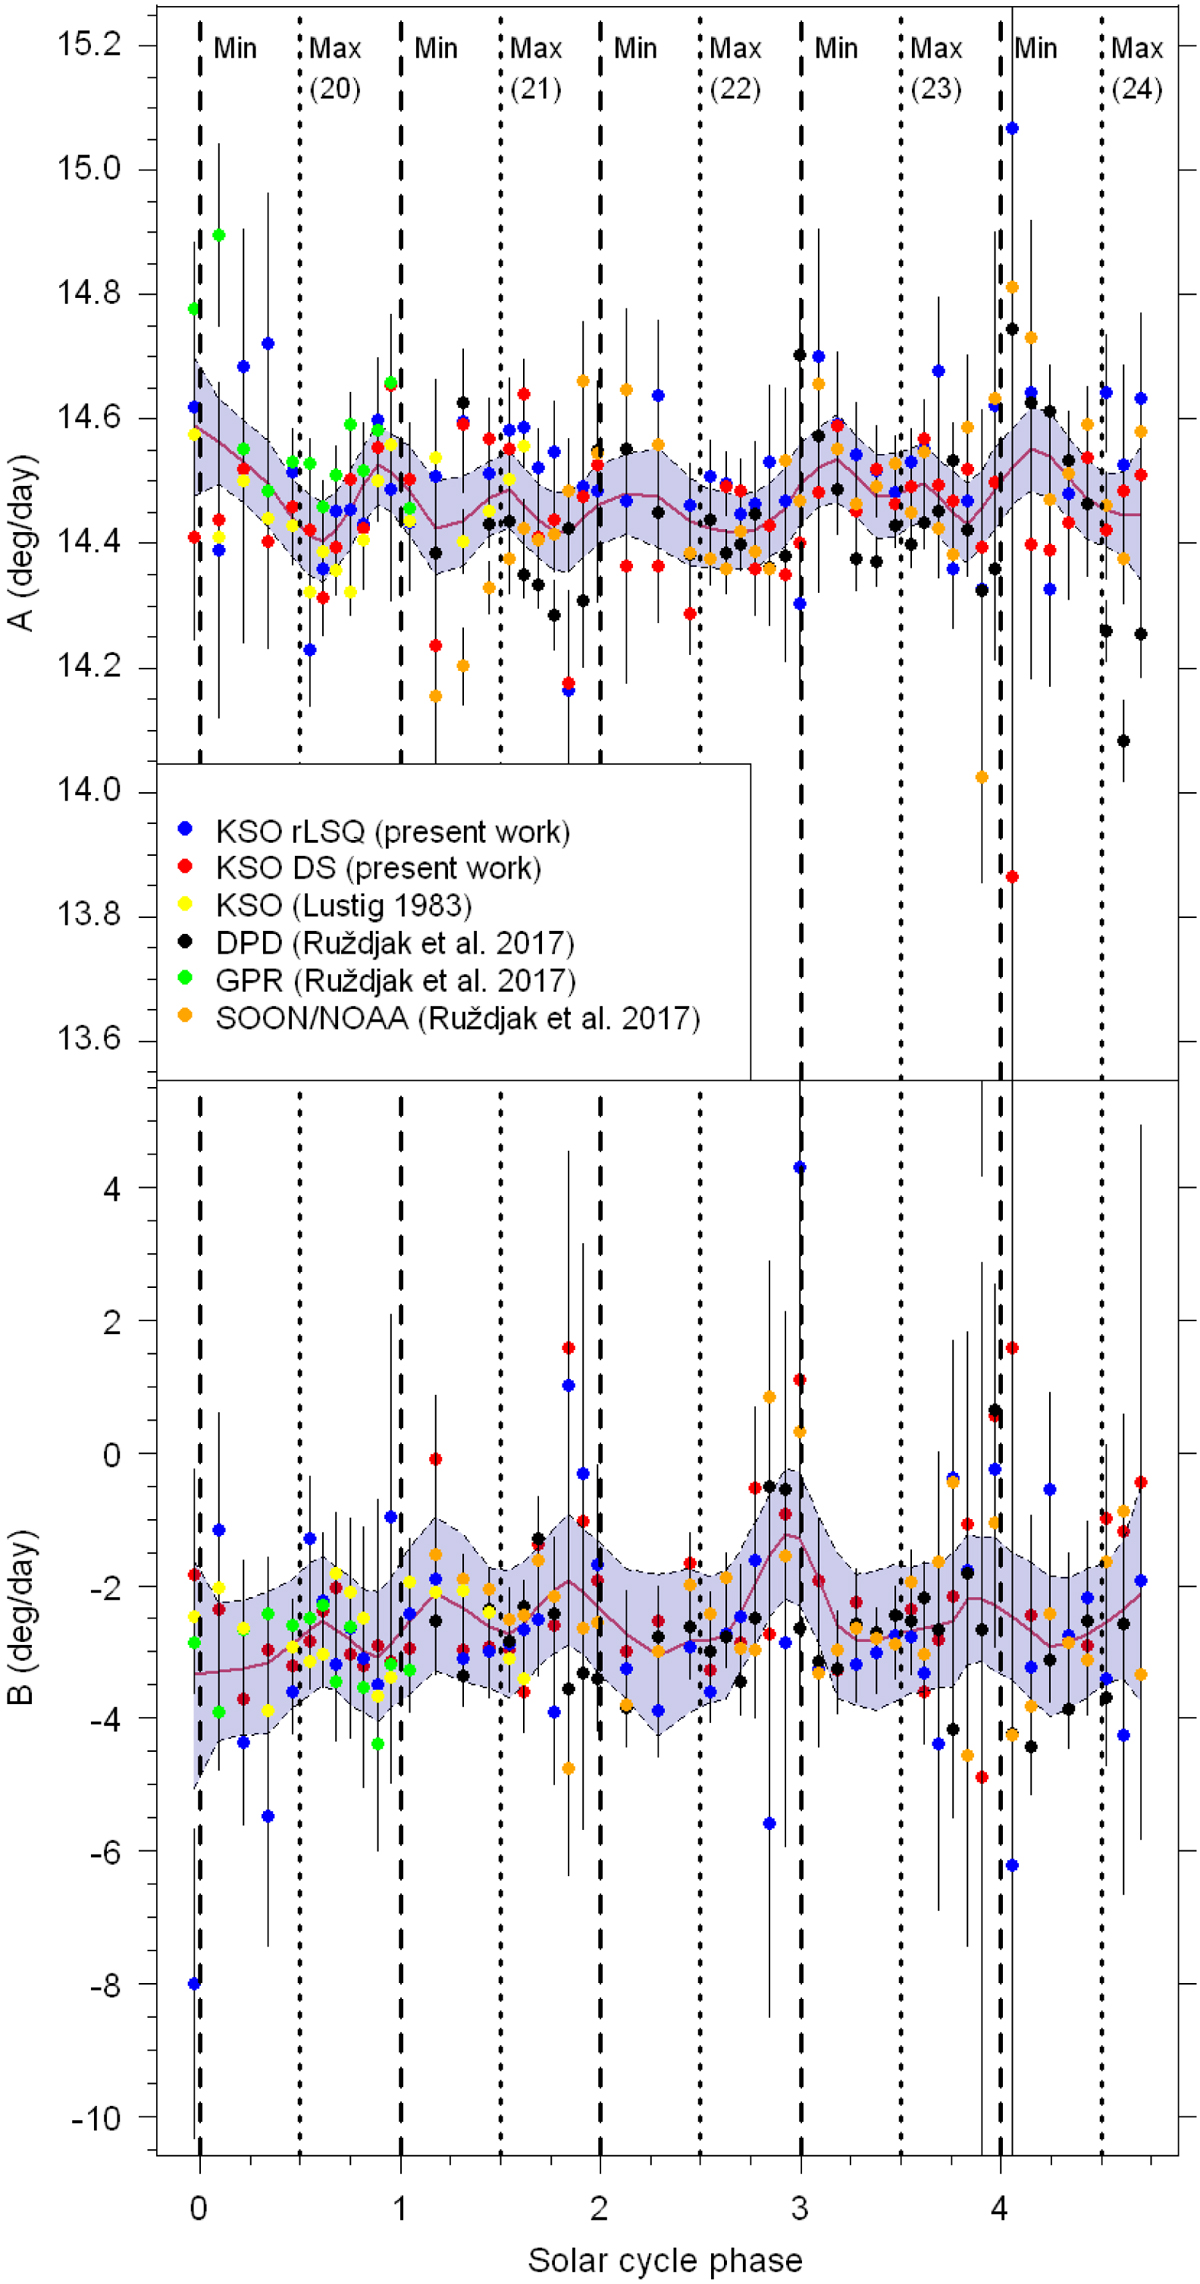
Fig. 2.
Download original image
In-cycle variation of the equatorial rotation velocity, represented by parameter A, and steepness of the differential rotation, represented by B, shown in phase space for SCs 20–24 (1964–2016) and both hemispheres together. Blue and red dots represent our KSO rLSQ and KSO DS values (1964–2016), yellow dots show KSO values from Lustig (1983) (1964–1981), and black, green, and orange dots show DPD, GPR, and SOON/NOAA values from Ruždjak et al. (2017). The red line represents the result of the LOESS, with the greyish part indicating the 95% confidence level. Full phases (0–5) correspond to the times of subsequent minima.
Current usage metrics show cumulative count of Article Views (full-text article views including HTML views, PDF and ePub downloads, according to the available data) and Abstracts Views on Vision4Press platform.
Data correspond to usage on the plateform after 2015. The current usage metrics is available 48-96 hours after online publication and is updated daily on week days.
Initial download of the metrics may take a while.