Open Access
Fig. 9
Download original image
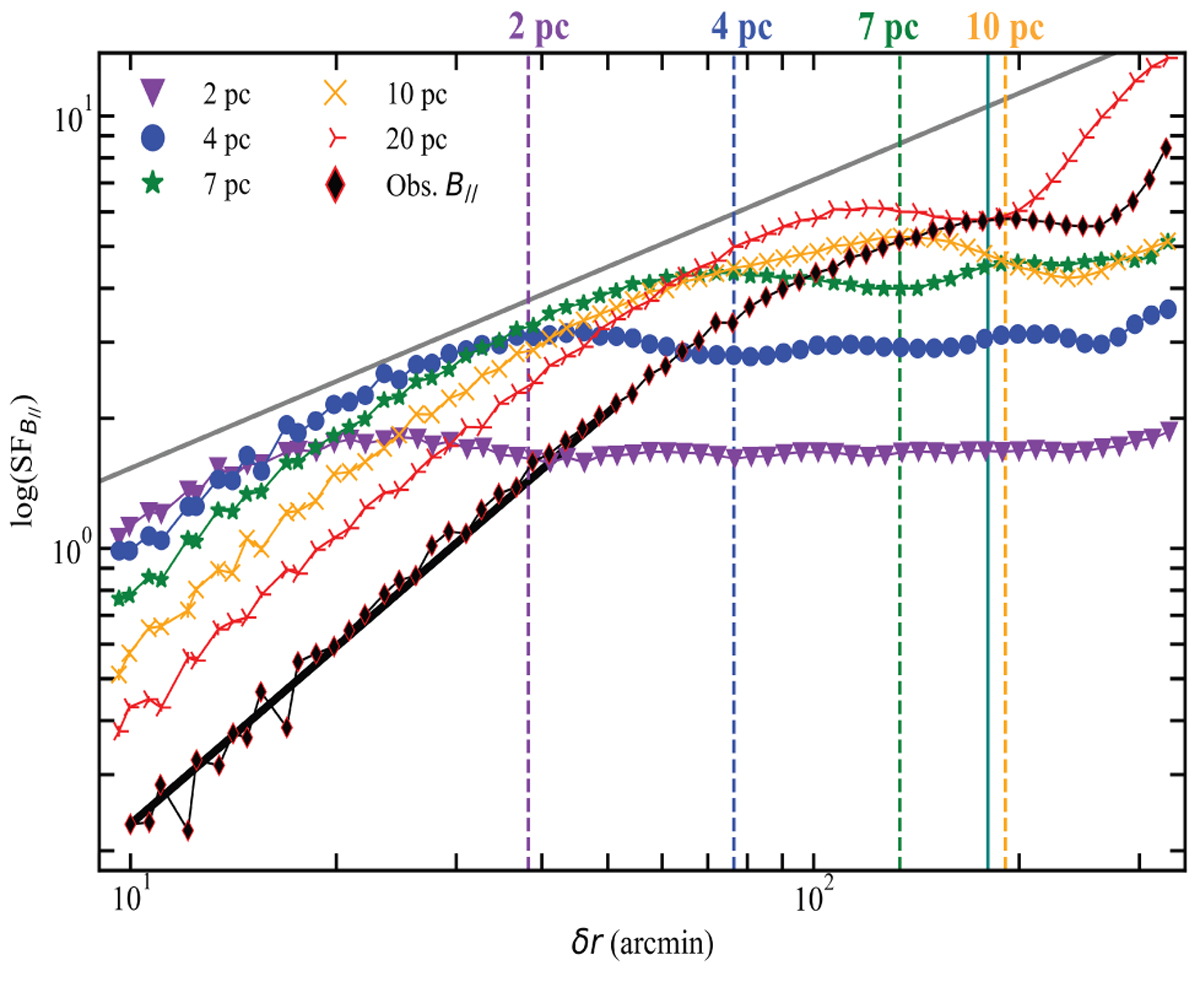
Structure functions of the observed (black) and the simulated B‖ with different outer scales. The outer scales (top) are related to each SF, coded in the same colour. The teal line represents half of the box size. The black line shows the power-law slope of 1.4. The grey line shows the 2/3 Kolmogorov scaling.
Current usage metrics show cumulative count of Article Views (full-text article views including HTML views, PDF and ePub downloads, according to the available data) and Abstracts Views on Vision4Press platform.
Data correspond to usage on the plateform after 2015. The current usage metrics is available 48-96 hours after online publication and is updated daily on week days.
Initial download of the metrics may take a while.