Fig. 3
Download original image
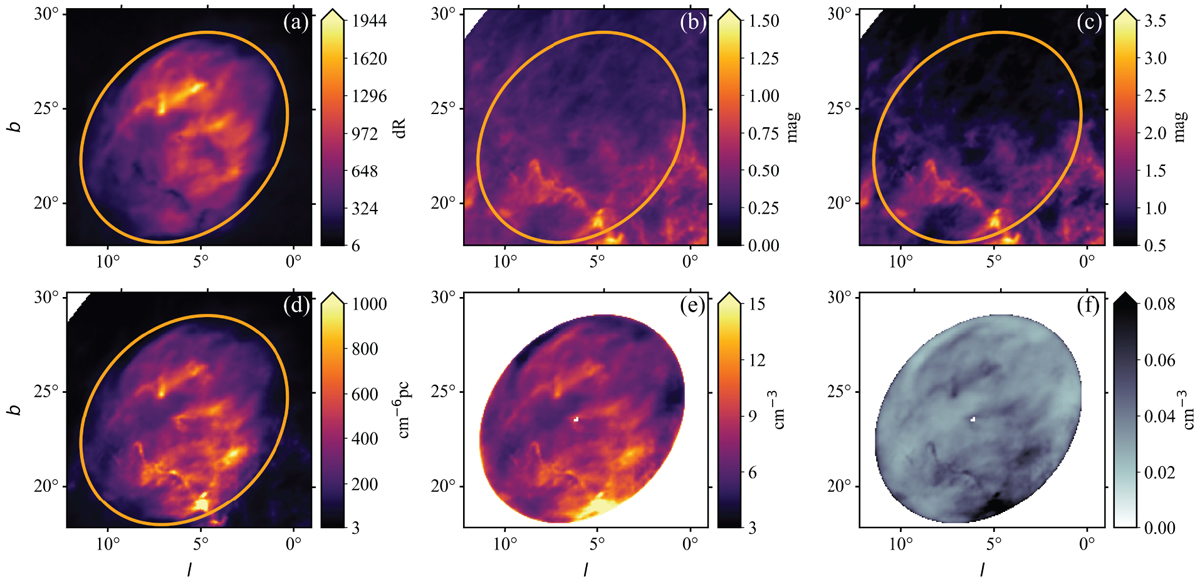
Efficacy of the extinction correction, as described in Sect. 4. (a) IHα; (b) E(B – V); (c) τ; (d) EM (colour-scale saturated to 1000 cm−6 pc, the maximum is 2251 cm−6 pc); (e) ne (colour-scale saturated to 15 cm−3, the maximum is 57.6 cm−3); ![]() (colour-scale saturated to 0.09 cm−3, the maximum is 0.29 cm−3). The orange elliptical region gives the area chosen for the LoS estimations. In (e) and (ƒ), ζ Oph is masked to prevent confusion in the colour-scale. Throughout the paper, the uncertainties are shown in grey scale.
(colour-scale saturated to 0.09 cm−3, the maximum is 0.29 cm−3). The orange elliptical region gives the area chosen for the LoS estimations. In (e) and (ƒ), ζ Oph is masked to prevent confusion in the colour-scale. Throughout the paper, the uncertainties are shown in grey scale.
Current usage metrics show cumulative count of Article Views (full-text article views including HTML views, PDF and ePub downloads, according to the available data) and Abstracts Views on Vision4Press platform.
Data correspond to usage on the plateform after 2015. The current usage metrics is available 48-96 hours after online publication and is updated daily on week days.
Initial download of the metrics may take a while.