Fig. 11
Download original image
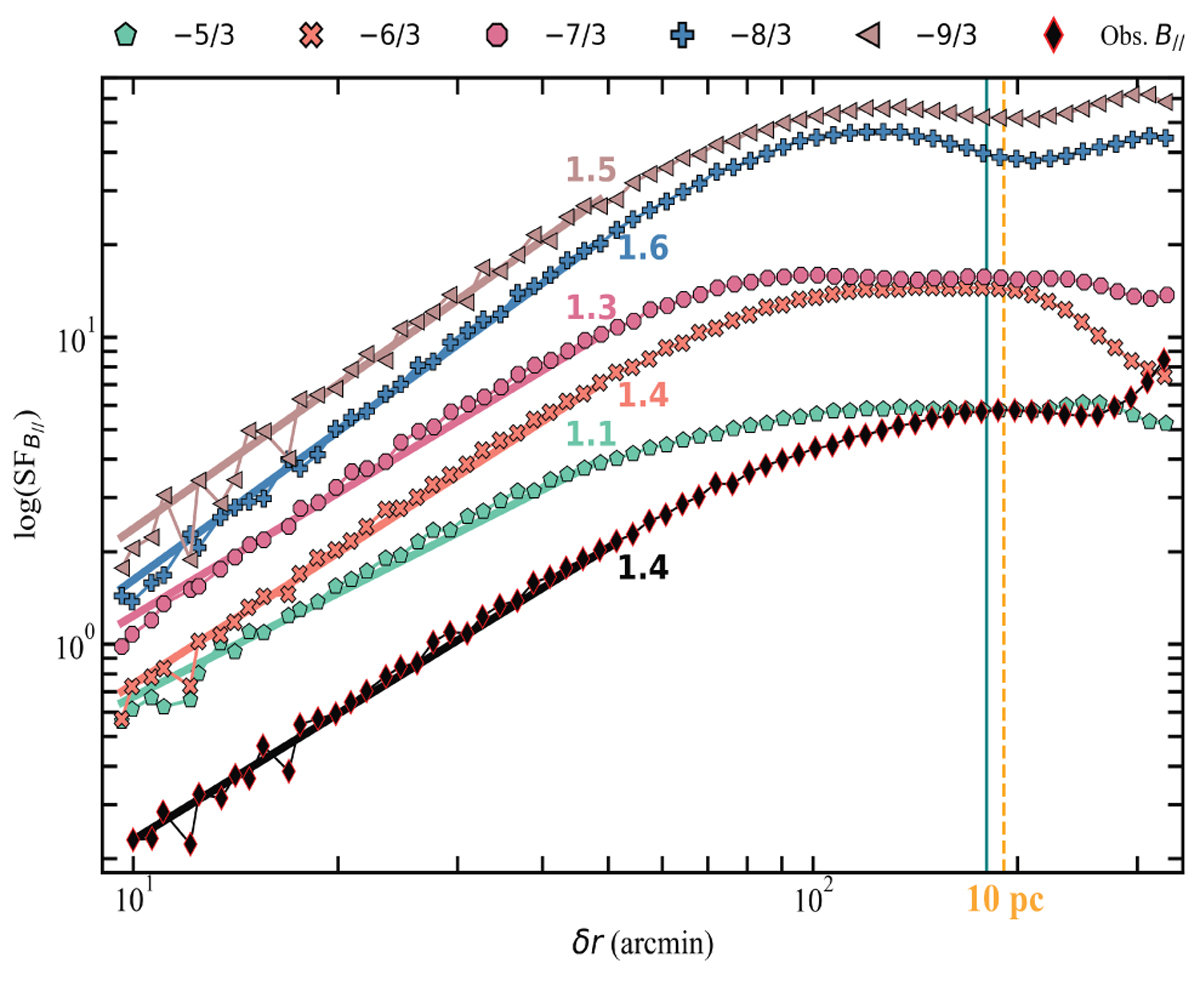
Structure functions of the observed (black) and simulated B‖. Each simulated ![]() is calculated with a different input slope (−9/3 ≤ β ≤ −5/3) with an outer scale of 10 pc, and with α = 2. The input 1D PS slopes of the input B‖ are shown in the legend. The power-law slopes of the resulting 2D SFs are shown next to the related data. The amplitude of each simulated
is calculated with a different input slope (−9/3 ≤ β ≤ −5/3) with an outer scale of 10 pc, and with α = 2. The input 1D PS slopes of the input B‖ are shown in the legend. The power-law slopes of the resulting 2D SFs are shown next to the related data. The amplitude of each simulated ![]() is sorted arbitrarily for a clear presentation. The teal line represents half of the box size.
is sorted arbitrarily for a clear presentation. The teal line represents half of the box size.
Current usage metrics show cumulative count of Article Views (full-text article views including HTML views, PDF and ePub downloads, according to the available data) and Abstracts Views on Vision4Press platform.
Data correspond to usage on the plateform after 2015. The current usage metrics is available 48-96 hours after online publication and is updated daily on week days.
Initial download of the metrics may take a while.