Fig. 1
Download original image
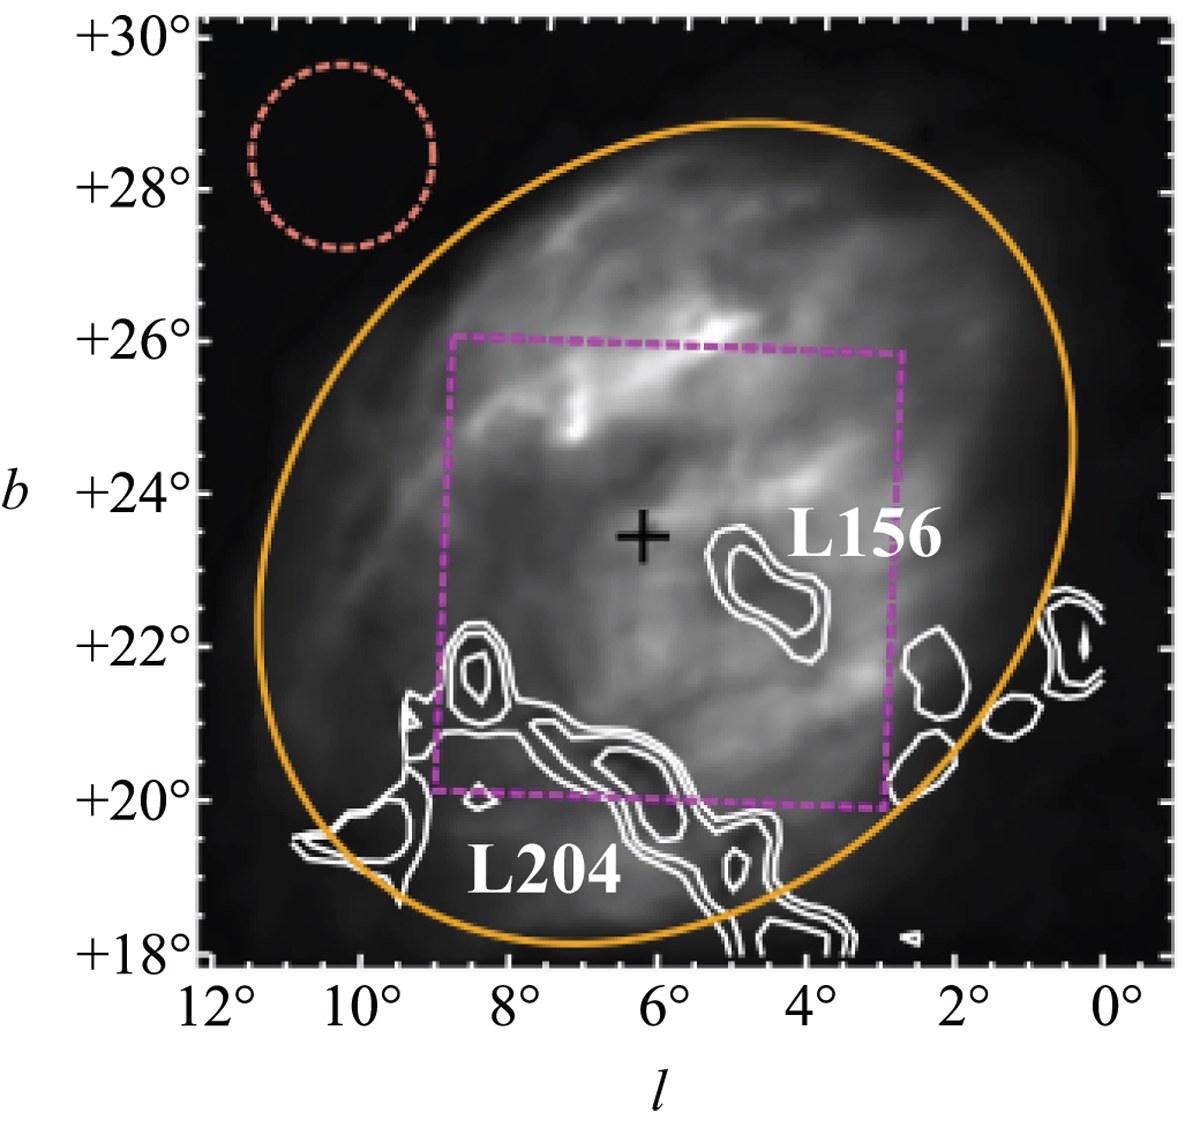
Selected regions and the dark clouds (this work) overlaid on the IHαmap of Sh 2–27. The dashed circle with a radius of 1°.2 is chosen to estimate the off-region used in RMsh2–27estimation (see Sect. 5.3). The dashed box is used for the SF calculations. Each side of the box is ~6°. Contours from the CO emission map of Dame et al. (2001) are overlaid on the H II region to display the structure of the dark clouds. The plus sign represents the location of ζ Oph at (l, b) = (6°.3, +23°.6). The greyscale range is 0–2000 dR.
Current usage metrics show cumulative count of Article Views (full-text article views including HTML views, PDF and ePub downloads, according to the available data) and Abstracts Views on Vision4Press platform.
Data correspond to usage on the plateform after 2015. The current usage metrics is available 48-96 hours after online publication and is updated daily on week days.
Initial download of the metrics may take a while.